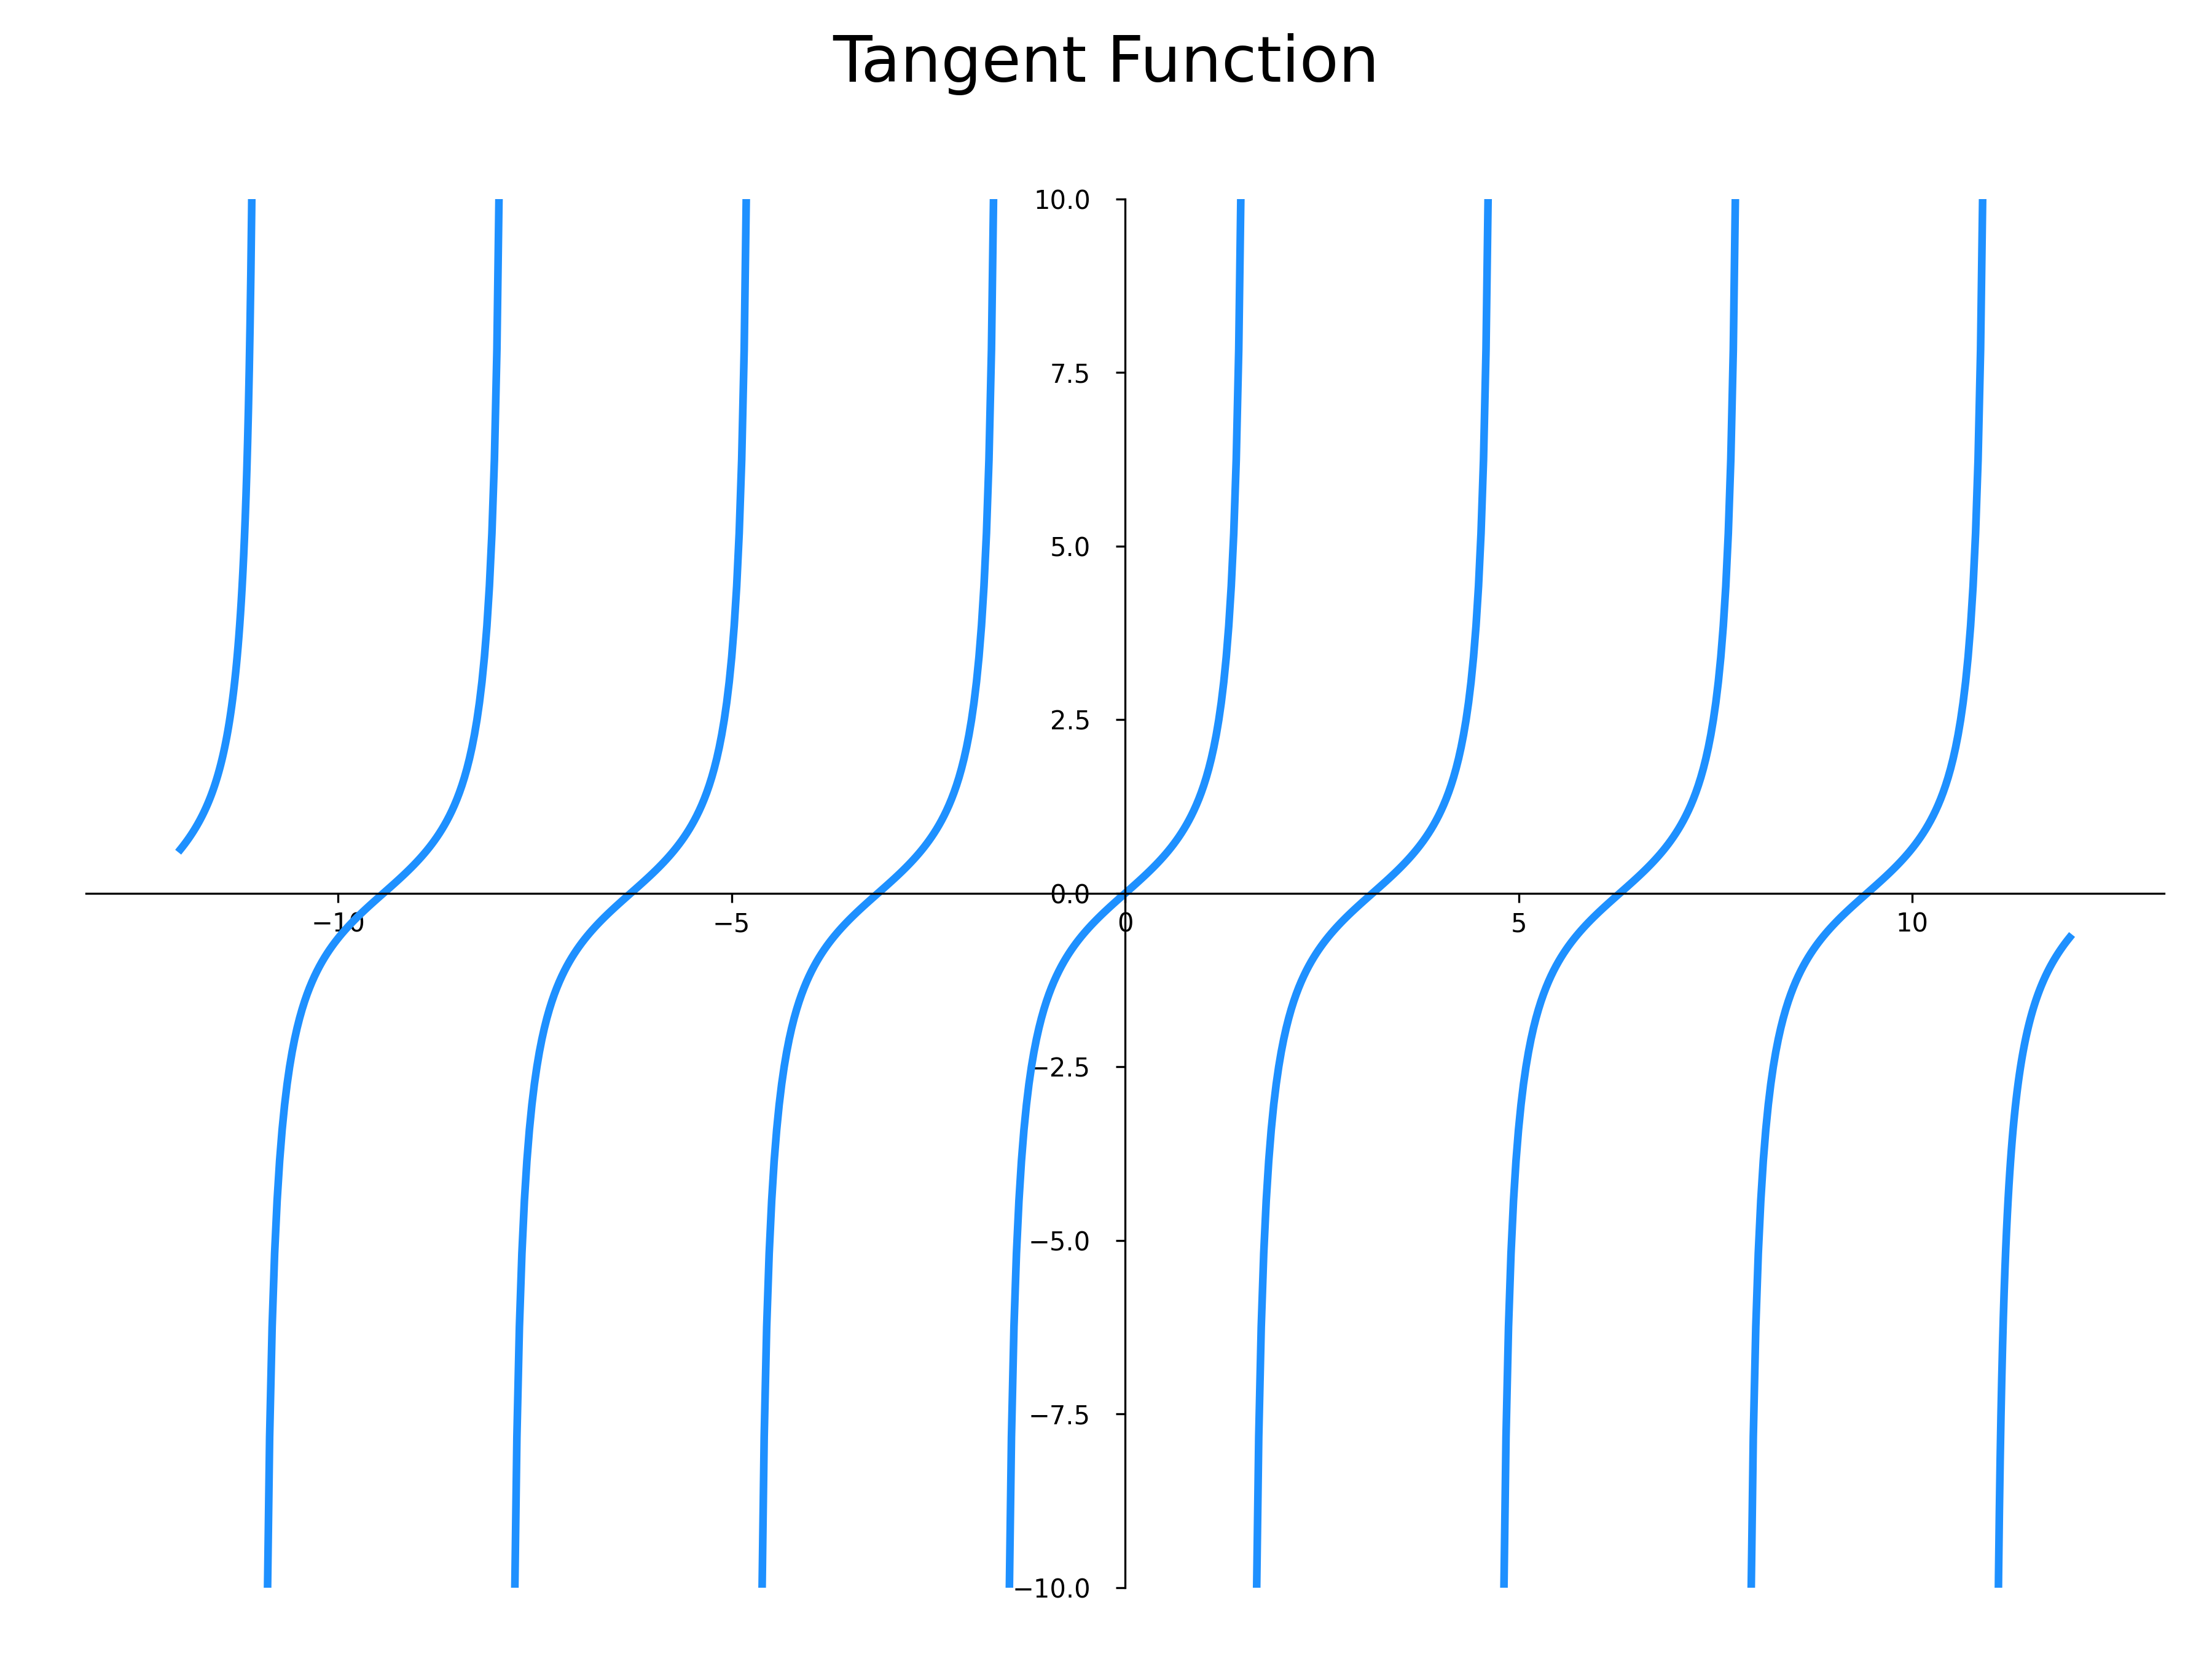
Plot the tangent function
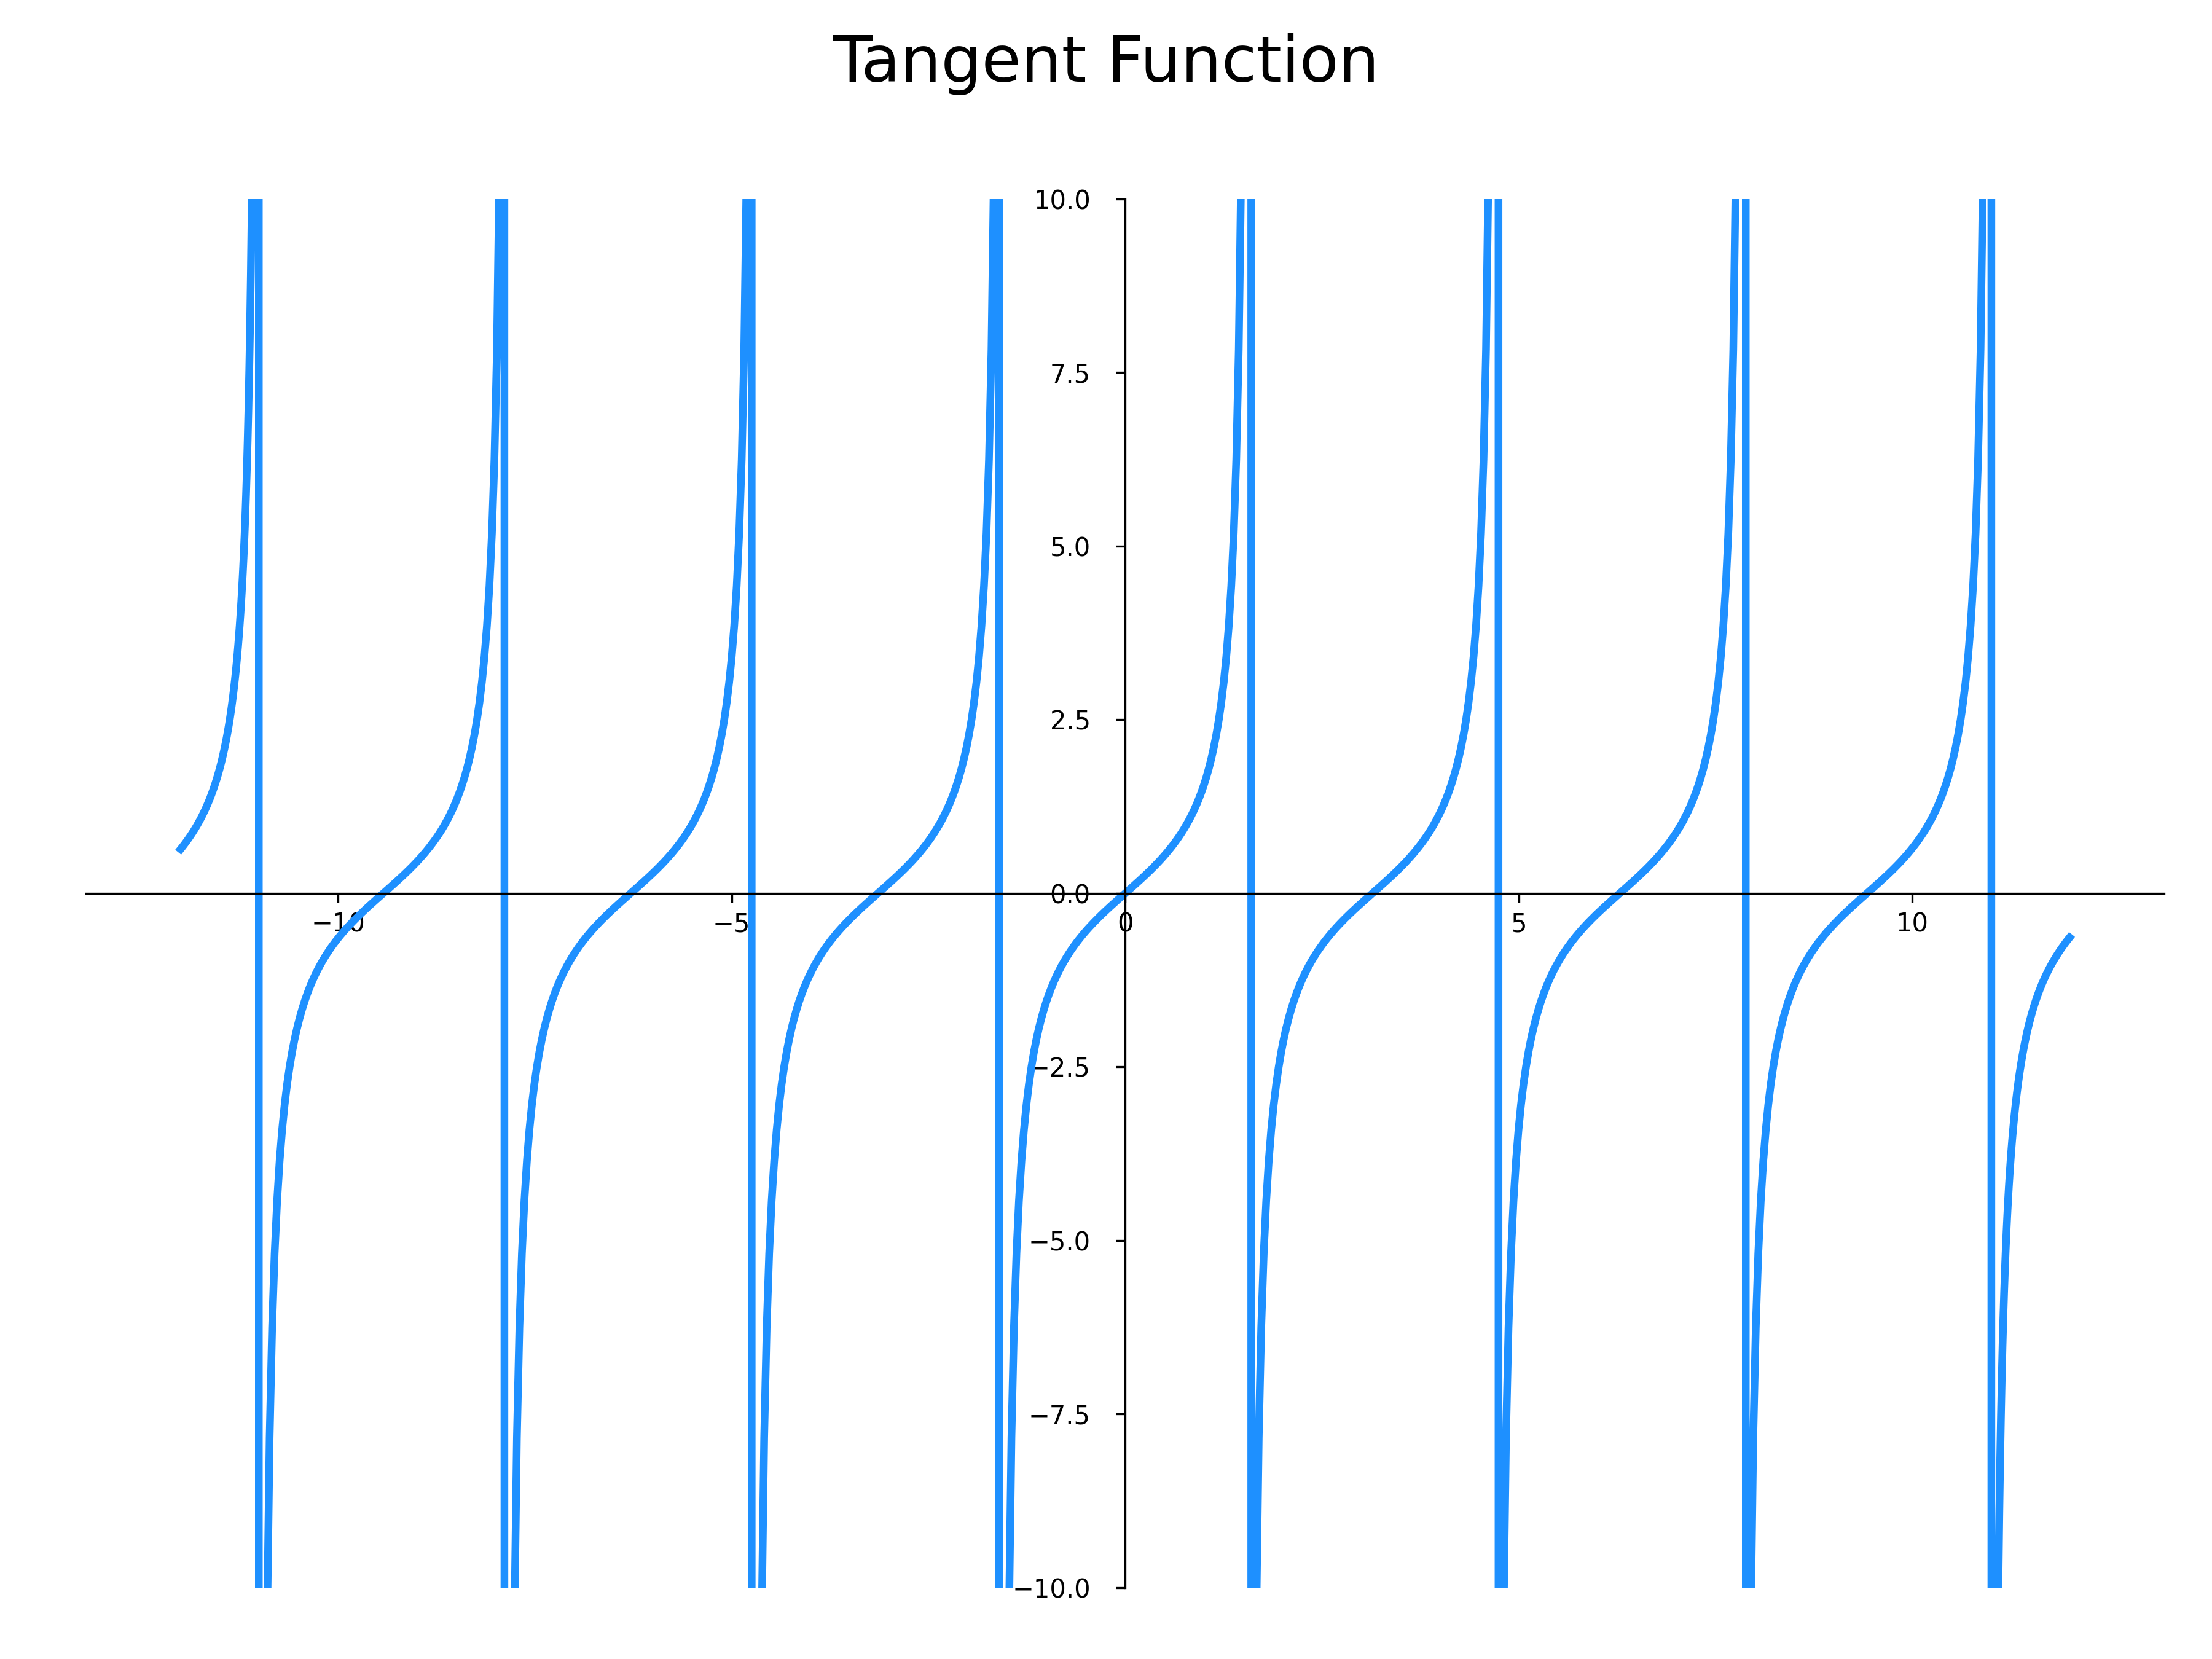
Plotting the tangent function may seem like a basic task, but one must consider the discontinuity points of the function. The plot function in matplotlib connects points, but if it connects all calculated points of the function over an interval that includes discontinuities, you end up with something like this and obviously, no one wants to see or produce such a representation :
To avoid connecting points across discontinuities, you can create a sequence of intervals where the function is continuous, and then use the plot function on each of these intervals. That's what the following code does. It can certainly be optimized, but it has the advantage of handling nested lists and their indexing, Euclidean divisions, and numpy.
XMIN = -12
XMAX = 12
n = int(abs(XMAX-np.pi/2) // np.pi)
m = int(abs(XMIN+np.pi/2) // np.pi)
intervals_pos=[[np.pi/2 + k* np.pi, np.pi / 2 + (k + 1) * np.pi] for k in range(n)]
intervals_pos.append([intervals_pos[-1][1],XMAX])
intervals_neg=[[-np.pi/2 - (k+1)* np.pi, -np.pi/2 - k * np.pi] for k in range(m)]
intervals_neg = intervals_neg[::-1]
intervals_neg.insert(0,[XMIN,intervals_neg[0][0]])
intervals = intervals_neg + [[intervals_neg[-1][1],intervals_pos[0][0]]]  + intervals_pos
fig,ax = figax()
fig.suptitle('Tangent Function',fontsize=25)
ax.set_ylim(-10,10)
for interval in intervals:
    interval[0]+=0.0001
    interval[1]-=0.0001
    x = np.linspace(*interval,100)
    y = np.tan(x)
    ax.plot(x,y,color=COLORS_LIGHT[0],linewidth=3)
    plt.show()