MATLPLOTLIB
Skip to a subsection :
MATLPLOTLIB: FIRST STEPS
What is Matplotlib ?
Matplotlib is a powerful data visualization library that allows you to create a wide range of static, animated, and interactive plots. It is a widely used library that provides a high-level interface for creating various types of plots, including line plots, bar plots, scatter plots, and more.
Why learning Matlplotlib ?
One of the main reasons to learn Matplotlib is that it is a powerful and flexible library. While other libraries like Seaborn can also provide plots, they are often built on top of Matplotlib and a designed to make it easier to create certain types of plots. By learning Matplotlib, you will understand how plots are created and you will have more control over the appearance and behavior of your plots. Once you have a solid understanding of Matplotlib, it would be beneficial to move on to learning a library like Seaborn, for creating more complex and attractive visualizationsWhat is pyplot ?
Pyplot is a module in the Matplotlib library that provides a high-level interface for creating plots. It provides functions for creating various types of plots, such as line plots, bar plots, scatter plots, and more.Prerequisite
ListsThe common uses of range, numpy , and functions will be explained.
Installation
To use the matplotlib library in your Python scripts, you will first need to install it on your system. This can be done using the pip package manager, which is a tool for installing and managing Python packages. To install matplotlib, open a terminal or command prompt and enter the following command:
pip install matplotlib
Once matplotlib is installed, you can import it into your script using the following line of code:
from matplotlib import pyplot as plt>
It is common practice to include this line of code at the beginning of any Python script that uses matplotlib. You will likely see this line in multiple examples. The pyplot submodule provides a number of functions for creating and customizing plots and figures using matplotlib. The 'as plt' portion of the line of code creates an alias for the pyplot module, allowing you to use the abbreviation 'plt' instead of typing out the full 'pyplot' module name each time you want to use one of its functions. Instead of writing 'matplotlib.pyplot.plot()', you can simply write 'plt.plot(') to use the plot function from the pyplot module. This can make your code easier to read and write, as you don't have to type out the full module name each time you want to use one of its functions.
This code generates a scatter plot of two points: (-1, -1) and (2, 3) :
from matplotlib import pyplot as plt
# define the coordinates of 2 points (-1, -1) and (2, 3) :
x=[-1,2] # define the x-coordinates of the two points
y=[-1,3] # define the y-coordinates of the two points
plt.scatter(x,y) # creates a scatter plot
plt.show() # display the plot
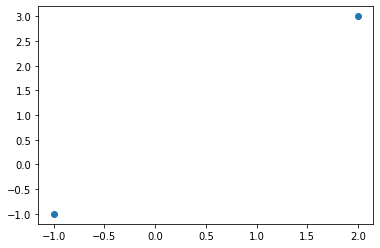
The "scatter" function is used to plot the points on the graph, and the "show" function is used to display the plot. the first point to be plotted is (-1, -1). This point has an x-coordinate of -1 and a y-coordinate of -1. it will be plotted at the position (-1, -1) on the graph, with the x-coordinate (-1) on the horizontal axis and the y-coordinate (-1) on the vertical axis. The scatter function expects two arguments: the x-coordinates and the y-coordinates of the points to be plotted. These coordinates are usually provided as lists of numbers. Using lists as arguments allows us to plot multiple points on the same graph. A scatter plot is a type of plot that displays each data point as a single point, rather than a line connecting the points. The plot is not displayed automatically. Instead, the plot is created and stored in memory, and it is up to you to decide when and how to display the plot. If you omit the show function, the plot will not be displayed. Instead, the plot will remain in memory and you can do further processing on it or save it to a file
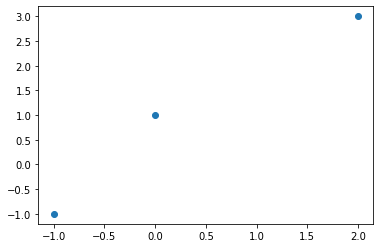
To plot more points, add more elements to the lists x and y:
from matplotlib import pyplot as plt
# define the coordinates of 2 points (-1, -1) , (2, 3) and (0,1)
x=[-1,2,0] # define the x-coordinates
y=[-1,3,1] # define the y-coordinates
plt.scatter(x,y)
plt.show()
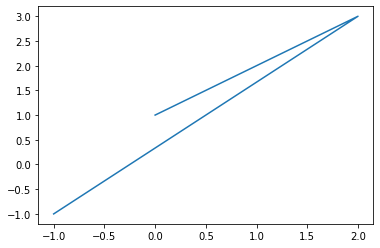
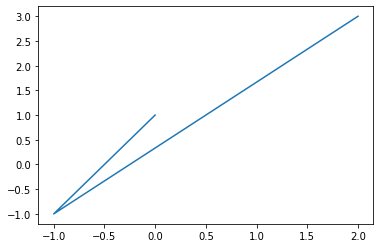
Instead of using the "scatter" function from pyplot to display individual dots on the graph, we can use the plot function to connect the points. The plot function is used to draw a line connecting the points in the order they are given.
from matplotlib import pyplot as plt
# define the coordinates of 3 points (-1, -1) , (2, 3) and (0,1)
x=[-1,2,0] # define the x-coordinates
y=[-1,3,1] # define the y-coordinates
plt.plot(x,y) # plot the points
plt.show()
changing the order of coordinates will connect the points in another way:
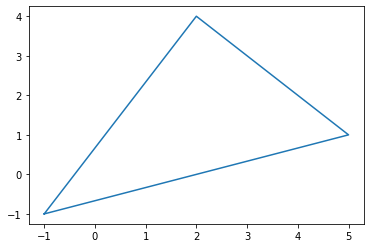
To draw a triangle, we need to define three points, and a fourth point is added to the lists x and y to close the triangle. The fourth point has the same coordinates as the first one
from matplotlib import pyplot as plt
x=[-1,2,5,-1] # define the x-coordinates
y=[-1,4,1,-1] # define the y-coordinates
plt.plot(x,y)
plt.show()
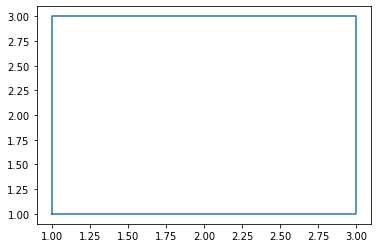
To draw a square, we need to define four points, and a fifth point is added to the lists x and y to close the square.
from matplotlib import pyplot as plt
x=[1,3,3,1,1] # defines the x-coordinates
y=[1,1,3,3,1] # defines the y-coordinates
plt.plot(x,y)
plt.show()
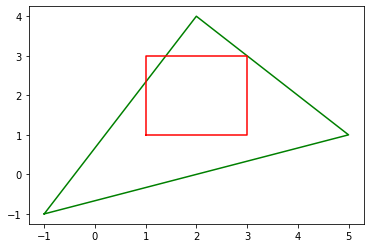
We can plot a triangle and a square by defining two sets of coordinates: one set for the triangle and another set for the square. To do this, you can use the plot function twice, once for each set of coordinates. Here is an example of how you might do this:
from matplotlib import pyplot as plt
x1=[-1,2,5,-1] # defines the x-coordinates of the triangle
y1=[-1,4,1,-1] # defines the y-coordinates of the triangle
x2=[1,3,3,1,1] # defines the x-coordinates of the square
y2=[1,1,3,3,1] # defines the y-coordinates of the square
plt.plot(x1,y1,'green') # plots the triangle using green
plt.plot(x2,y2,'red') # plots the square with using red
plt.show()