Now that you know the basics of how to create simple plots with just a few points or shapes, you can use Pyplot to plot functions. For example, you can use it to plot the graph of a mathematical function like y = x^2 over a certain range of values for x. You can also customize the appearance of the plot by changing the colors, line styles, axis labels, and many other options.
Skip to a subsection :
- Generate Values
- Plot a function
- Customize the plots
- Figure, Axes, Axis
- Subplots
- Resize the figure
- Titles
- Labels and legends
- Limits
- Colors
- Layout
- Sheat Sheet
1. GENERATE VALUES
Generate values manually
Manually generating x and y values is a viable option when the number of values is not too large. As we explore other techniques in the following sections of the website, we will work with larger data sets This example demonstrates the basics of creating a line graph using a small data set, which is stored manually in lists of x and y values.import matplotlib.pyplot as plt x=['jan','fev','mar','may','jun','jul'] y=[6,7,6,7,6,9] plt.plot(x,y) plt.show()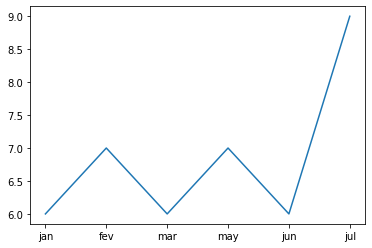
Generate values with range and list comprehensions
Efficient methods, such as range or list comprehensions, automatically produce sequences of values for our calculations. This code is creating a sequence of x values from -3 to 2, and using those x values to calculate a corresponding sequence of y values using the formula y=2x+1.from matplotlib import pyplot as plt # creates a range object that starts at -3 and goes up to, but not including, 3, so the elements in this range are -3,-2,-1,0,1,2 : x1 = range(-3,3) # uses a list comprehension to create a new list y1, where each element is calculated by the formula 2*x+1 for each element x in the x1 range. y1=[2*x+1 for x in x1] print(y1) # prints [-5, -3, -1, 1, 3, 5] # we can now plot the graph of y1 against x1, with the result is that x1 = [-3,-2,-1,0,1,2] and y1 = [-5, -3, -1, 1, 3, 5] plt.plot(x1,y1) plt.show()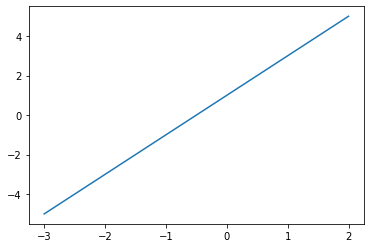
List comprehensions can also generate a sequence of x values. For example, this will generate a sequence of floating-point values from 0.0 to 1.0, with a step size of 0.1.
x = [i/10 for i in range(0, 11)]
print(x) # prints  [0.0, 0.1, 0.2, 0.3, 0.4, 0.5, 0.6, 0.7, 0.8, 0.9, 1.0]
Generate values with Numpy
NumPy provides efficient functions for generating arrays of numerical data. One such function is linspace, which generates a sequence of evenly spaced values over a specified interval. For example, you can use linspace to generate 11 values between 0 and 5 like this:
Another commonly used Numpy function is arange. This line of code is using numpy.arange function to create an array with evenly spaced values starting from 0, and going up to, but not including, 11, with a step of 2 :import numpy as np x = np.linspace(0, 5, 11) print(x) # prints [0. 0.5 1. 1.5 2. 2.5 3. 3.5 4. 4.5 5. ]
To summarize, numpy.linspace takes a specified number of values and calculates the corresponding intervals between them, while numpy.arange takes a defined interval and calculates the number of values that fit within that interval. Once the x values are defined, we can use list comprehension again to generate the corresponding y valuesimport numpy as np x = np.arange(0, 11, 2) print(x) # prints [ 0 2 4 6 8 10]x = np.linspace(0, 5, 11) y = [ 2*x+1 for x in x] print(y) # prints [1.0, 2.0, 3.0, 4.0, 5.0, 6.0, 7.0, 8.0, 9.0, 10.0, 11.0]
Generate y values with a function
Let's define the function we want to plot and generate the corresponding y values for it. A function is a block of organized, reusable code that performs a specific task. In Python, you can define your own functions using the def keyword. Here is an example of how to define a function that takes an input value x and returns the value of the equation y = x**2 ( x squared function):
def f(x):
    y = x**2 # x squared function
    return y
To use this function, you can call it and pass in a value for x:
result = f(3)
print(result)  # prints: 9
A Python function can be applied to a single value by passing the value as an argument to the function but it can also be applied to a numpy object generated using linspace()) or arange(). Then the resulting sequence of y values can be used to plot a graph. But when generating a sequence of y values based on a list of x values, it is necessary to use a list comprehension or a loop
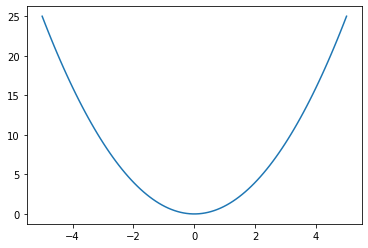
from matplotlib import pyplot as plt
import numpy as np

# define the f function x squared
def f(x):
    return x**2

# define a sequence of x values generated using numpy
x1 = np.linspace(0, 5, 11)
# define a sequence of y values generated using f function and x values
y1=f(x1)
# connect the points in the order they appear in the numpy arrays :
plt.plot(x1,y1)

# define a sequence of x values generated using a list
x2 = [-4,-3,-2,-1]
# define a sequence of y values generated using f function and a list comprehension
y2= [f(x) for x in x2]
# connect the points in the order they appear in the lists :
plt.plot(x2,y2)

plt.show()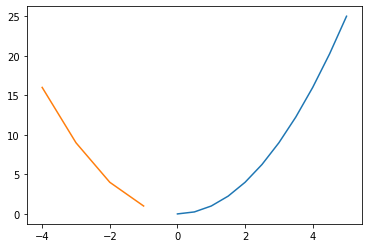
2. PLOT A FUNCTION
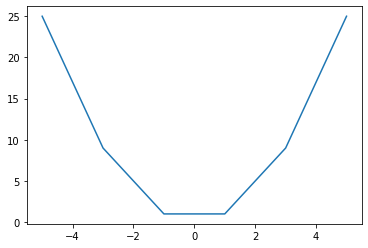
Increasing the number of points in the numpy linspace argument will increase the density of data points, resulting in a rough plot. This is how the plot would be for the same function when the linspace argument is 6 and when it is 100.
3. CUSTOMIZE THE PLOTS
With just a few extra lines of code, you can make your plots look exactly how you want them to. To accomplish this, understanding the difference between the Figure , the Axes and the Axis is particularly beneficial.
FIGURE, AXES, AXIS
The Figure is the overall window or page that everything is drawn on. It's like a blank canvas
the Axes object is the container object or a rectangular area that holds all the elements of the plot such as the axis, lines, points, etc.. it contains many methods, including setting axis limits, labels, and ticks. They are like the frames that you put on the canvas to display different plots or charts.
the Axis objects are like the rulers that you use to measure the data plotted in each Axes object. Each Axis object represents one of the two axis, the x and y axis. The Axis objects are responsible for displaying the data in a certain scale, they have their own properties such as the limits (xlim, ylim), the ticks, the labels.
Title(),legend(), annotate(), grid(), scatter(), text,set_xlabel() are methods of the Axes class that are not in the axis
set_xlim() set_ticks() set_ticklabels() are methods of the Axis objects
SUBPLOTS
To effectively customize axes, it is also important to have a basic understanding of subplots() or subplot() functions.
subplots() creates a figure and an array of subplots in one call. It allows to easily create multiple plots within a single figure. The function returns a figure object and an array of Axes objects, which can be used to plot data and customize the appearance of the subplots. The typical use of this function is :
fig, ax = plt.subplots()The new figure and the set of axes are stored in two variables, commonly named fig and ax or axs. Fig is the Figure object and ax is the numpy array of Axes objects. Then you can use these objects to further customize the figure and subplots, such as adding titles, labels, and adjusting the size and layout of the subplots. And you can create multiple subplots with ease and in a structured way, avoiding repetitive code.
To create a single plot : the example below shows how suplots() works without argument then with the number of rows and columns as arguments
# no argument : creates a single Axes object on the figure
from matplotlib import pyplot as plt
fig, ax = plt.subplots()
plt.show()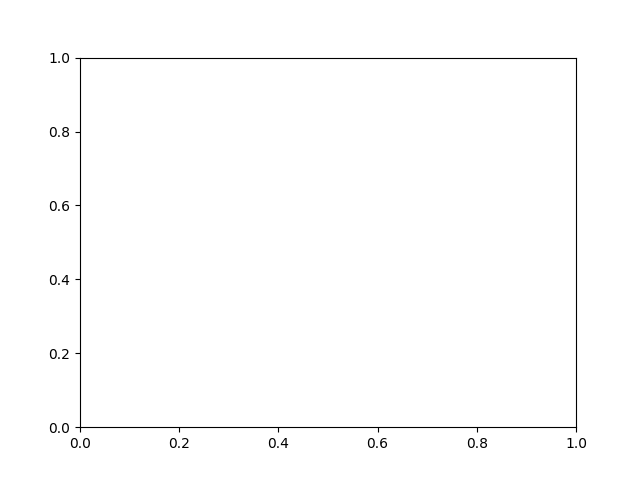
# creates 6 Axes objects within a figure, 2 rows, 3 columns.
from matplotlib import pyplot as plt
fig, axs = plt.subplots(2,3)
plt.show()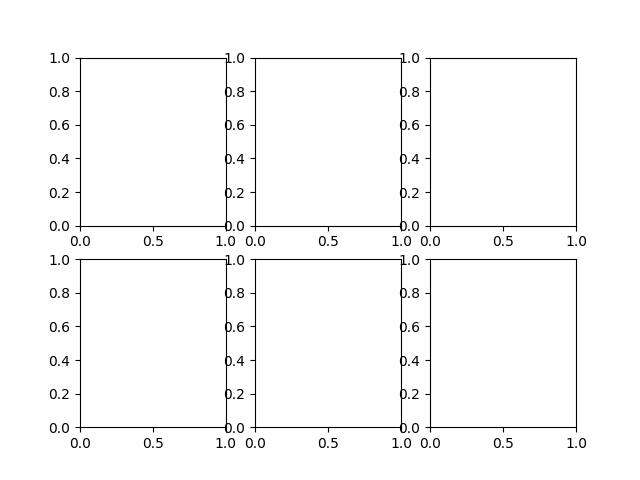
When using the subplots() function to create multiple plots in a single figure, each subplot is assigned a unique Axes object. These objects can be accessed by different means. For instance, here are some examples of how to add text to a specific Axes object within a set of Axes with 2 rows and 2 columns. 0.5,0.5 defines the coordinates of the text within the Axes object
from matplotlib import pyplot as plt
fig, axs = plt.subplots(2,2)
axs[0, 0].text(0.5,0.5,"A")
axs[0][1].text(0.5,0.5,"B")
plt.subplot(2,2,4).text(0.5,0.5,"C")
plt.show()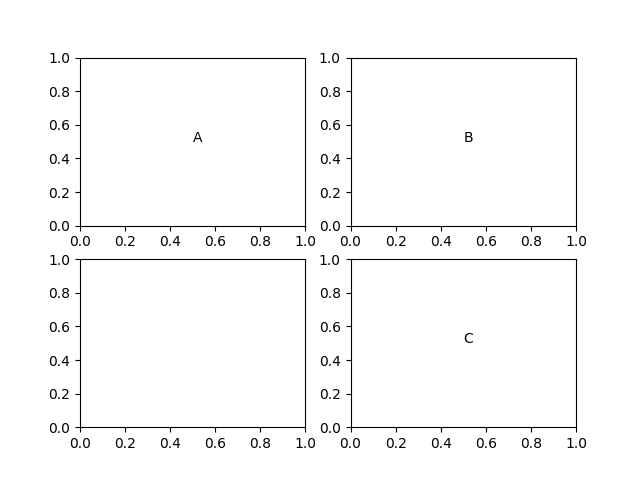
When subplots are arranged in multiple rows and columns, two indexes are used as in a matrix. When the subplots are arranged in a single row or a single column, you can access them using a single index, like a list. For example, axs[0] would give you the first subplot if the subplots are arranged in a single row, and axs[1] would give you the second subplot.
# plots in a single row
from matplotlib import pyplot as plt
fig, axs = plt.subplots(1,3)
axs[0].text(0.5,0.5,"A")
axs[1].text(0.5,0.5,"B")
plt.subplot(1,3,3).text(0.5,0.5,"C")
plt.show()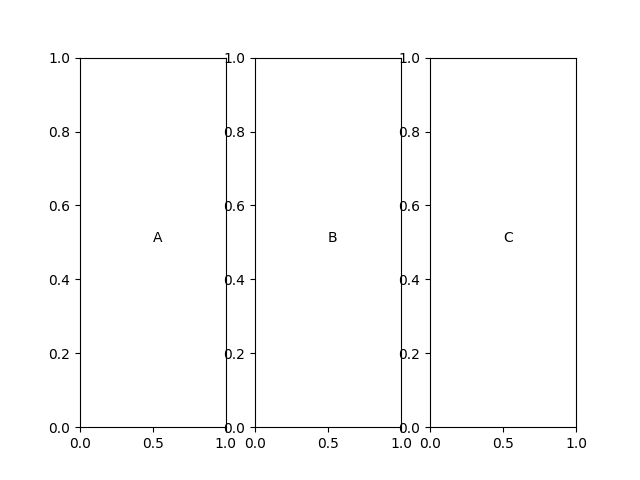
# plots in a single column
from matplotlib import pyplot as plt
fig, axs = plt.subplots(3,1)
axs[0].text(0.5,0.5,"A")
axs[1].text(0.5,0.5,"B")
plt.subplot(3,1,3).text(0.5,0.5,"C")
plt.show()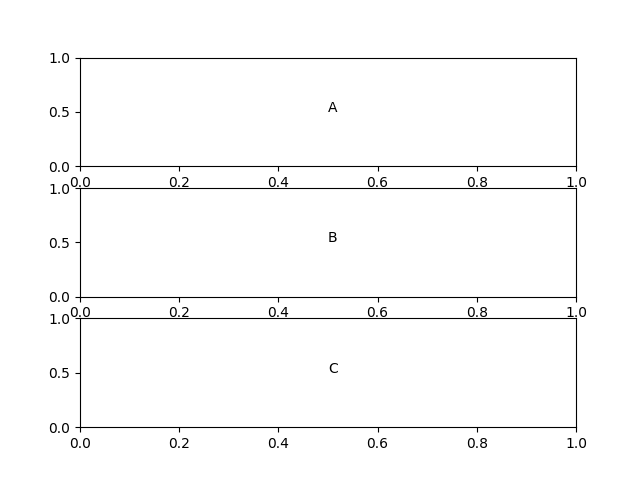
subplot(), without s, creates a single plot. It takess three arguments: the number of rows, the number of columns, and the index of the subplot. To create 6 Axes as above, it requires more lines of code :
# creates 6 Axes objects within a figure, 2 rows, 3 columns
from matplotlib import pyplot as plt
fig = plt.figure()
ax1 = plt.subplot(2,3,1)
ax2 = plt.subplot(2,3,2)
ax3 = plt.subplot(2,3,3)
ax4 = plt.subplot(2,3,4)
ax5 = plt.subplot(2,3,5)
ax6 = plt.subplot(2,3,6)
plt.show()
gca() : stands for "get current axis". It returns the current axis in the current figure.
gcf() : stands for "get current figure". It returns the current figure
RESIZE THE FIGURE
figure() : creates a new figure and allows you to specify the size of the figure in inches.
set_size_inches() : changes the size of an existing figure.# a new figure with a width of 10 inches and a height of 7 inches: fig = plt.figure(figsize=(10, 7))# a figure with a width of 10 inches and a height of 7 inches: plt.gcf().set_size_inches(10, 7)
TITLES
suptitle() : adds a title to the figure
set_title() : adds a title to the Axes objectfrom matplotlib import pyplot as plt fig,axs = plt.subplots(1,2) fig.suptitle("FIGURE TITLE") axs[0].set_title("Axes Title") axs[1].set_title("Another Axes Title") plt.show()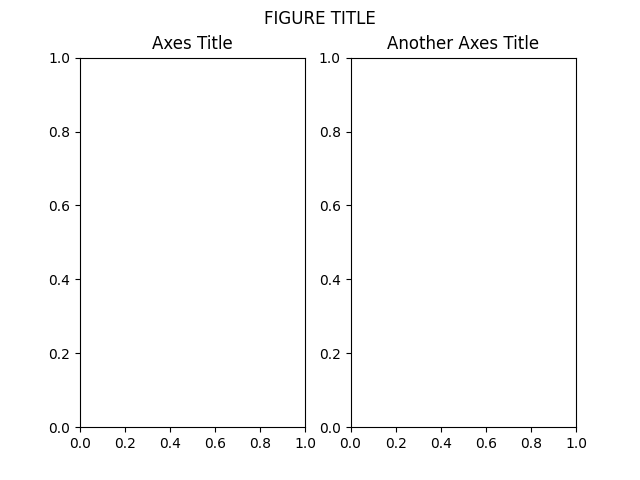
Font name, size, weight and style can be changed by passing these arguments in set_title(), as illustrated in the following code. The plt.axis('square') and fig.subplots_adjust(hspace=0.5) lines have been used to improve the readability of the example, these options will be covered in more detail later
from matplotlib import pyplot as plt
fig,axs = plt.subplots(2,3)
fig.suptitle("Font Size and Weight:")
axs[0,0].set_title("fontsize : 18", fontsize=18)
axs[0,1].set_title("weight : bold",weight="bold")
axs[0,2].set_title("style : italic",style="italic")
axs[1,0].set_title("font : garmond", fontname="garmond")
axs[1,1].set_title("font : courier new", fontname="courier new")
axs[1,2].set_title("font : verdana", fontname="verdana")
plt.axis('square')
fig.subplots_adjust(hspace=0.5)
plt.show()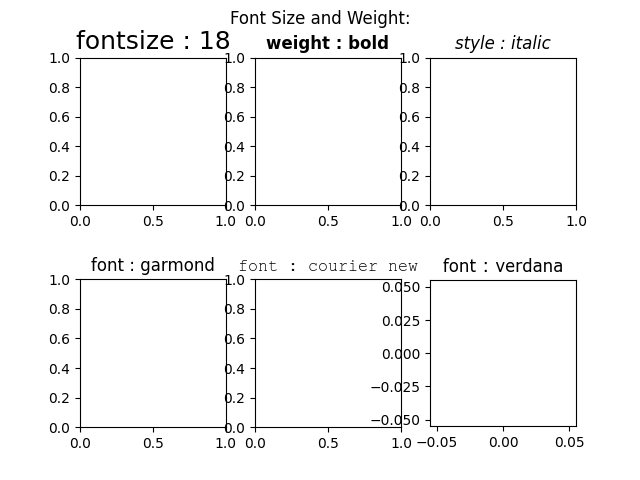
LABELS AND LEGENDSThe set_xlabel and set_ylabel functions are used to label the x-axis and y-axis and provide a descriptive name for each axis, which makes the plot more readable and understandable.
from matplotlib import pyplot as plt
    x = ["Mon", "Tue", "Wed", "Thu", "Fri", "Sat", "Sun"]
    y = [7600, 12952, 3300, 6899, 2300, 12117, 9000]
    fig,ax = plt.subplots()
    ax.set_xlabel('DAYS',color='red')
    ax.set_ylabel('SOME Y VALUES',color='red')
    plt.plot(x,y)
    plt.show()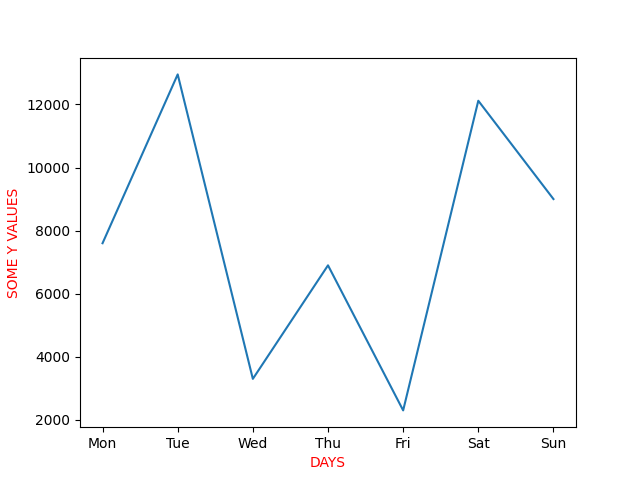
label is an argument of the 'plot" function. It's used to specify a label for the plotted data and is displayed in the legend. It is generally considered a better practice to create both a legend and labels for a chart. Labels provide specific information about each plotted data set, while the legend groups these labels together and provides a clear and concise key for the reader to understand the meaning of each plotted data set in the chart. By combining both labels and a legend, you provide both detailed information and a simple way to understand the plotted data. This is better illustrated by a scenario where there are at least two sets of data plotted in the same chart. In such a case, label is used to give each plotted data set a descriptive name.
from matplotlib import pyplot as plt
x = ["Mon", "Tue", "Wed", "Thu", "Fri", "Sat", "Sun"]
y1 = [7600, 12952, 3300, 6899, 2300, 12117, 9000]
y2 = [1200, 2500, 1310, 3900, 3000, 2000, 3400]
fig,ax = plt.subplots()
plt.plot(x,y1,label='1st LABEL : 1st set of data , x and y1 values')
plt.plot(x,y2,label='2nd LABEL : 2nd set of data, x and y2 values')
ax.legend(title='A LEGEND ')
plt.show()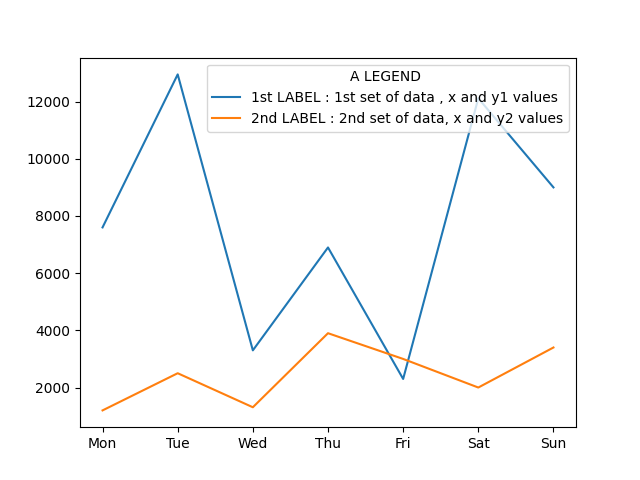
First you need to use the plot function to define the data points and the appearance of the plot. Then, you can add a legend to it by using the legend() function You can set the position of the legend within the axes using the loc argument of the legend function. The loc argument accepts a string or an integer that specifies the location of the legend. The locations include: 'upper left' (default), 'upper right' , 'lower left','lower right', 'right', 'center left','center right', 'lower center', 'upper center', 'center'
If a legend is added without labels, python will return a warning message.
In this code, a color has been added to make the legends more readable :
from matplotlib import pyplot as plt
fig,axs = plt.subplots(2,3)
x = [1,2,3,4,5,6,7]
y = [7600, 12952, 3300, 6899, 2300, 12117, 9000]
axs[0,0].plot(x,y,label="data",color='red')
axs[0,0].legend(title='Legend : upper right', loc='upper right',facecolor='cyan')
axs[0,1].plot(x,y,label="data",color='red')
axs[0,1].legend(title='Legend : lower left',loc='lower left',facecolor='cyan')
axs[0,2].plot(x,y,label="data",color='red')
axs[0,2].legend(title='Legend : center',loc='center',facecolor='cyan')
axs[1,0].plot(x,y,label="data",color='red')
axs[1,0].legend(title='Legend : upper center',loc='upper center',facecolor='cyan')
axs[1,1].plot(x,y,label="data",color='red')
axs[1,1].legend(title='Legend : lower right',loc='lower right',facecolor='cyan')
axs[1,2].plot(x,y,label="data",color='red')
axs[1,2].legend(title='Legend : right',loc='right',facecolor='cyan')
plt.show()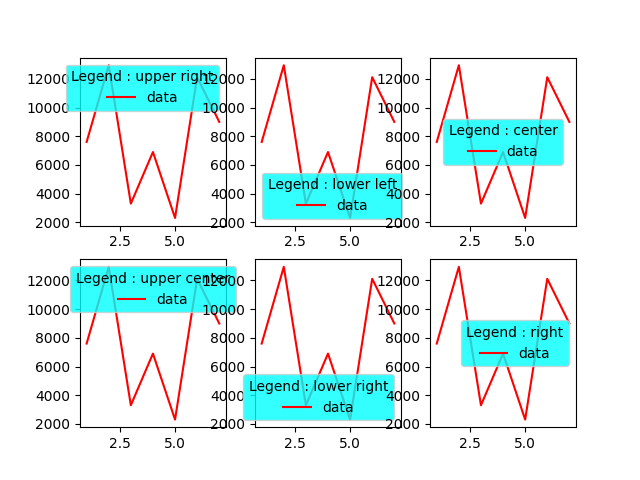
However, sometimes you may want more precise control over the legend's position. This is where the bbox_to_anchor argument comes in. It allows you to specify the exact coordinates of the legend box, relative to the plot.
For example, if you set bbox_to_anchor=(0.8,-0.2), it means that you want the legend to be placed at a point that is 80% of the plot's width to the right, and 20% of the plot's height below the bottom of the plot. The ncol parameter in the ax.legend() function specifies the number of columns that the legend should have.
ax.legend(bbox_to_anchor=(0.8,-0.2),ncol=5)
It is possible to combine the loc and bbox_to_anchor parameters, which allows you, for example, to position the legend at the top center without overlapping on the graph.
ax.legend(loc='upper center',
bbox_to_anchor=(0.5, 1.25), ncol=len(parameters)  )
LIMITS : xlim, ylim, xbound, ybound
The x-axis and y-axis will be automatically scaled to fit the data that you have plotted. xlim and ylim allow you to specify the range of values that should be shown on the x-axis and y-axis.
xlim and ylim can be thought of as a way of zooming in or out on the x-axis, by specifying the range of values to be displayed
Here's an example :from matplotlib import pyplot as plt fig,ax = plt.subplots(2,2) x = np.linspace(-5, 5, 30) y=[-x**3 for x in x] ax[0,0].plot(x,y) ax[0,0].set_title("default settings") ax[0,1].plot(x,y) ax[0,1].set_xlim(-2, 2) ax[0,1].set_title("set_xlim(-2, 2)") ax[1,0].plot(x,y) ax[1,0].set_ylim(0, 20) ax[1,0].set_title("set_ylim(0, 20)") ax[1,1].plot(x,y) ax[1,1].set_xlim(-20, 20) ax[1,1].set_ylim(-200, 200) ax[1,1].set_title("set_xlim(-20, 20) and set_ylim(-200, 200)") fig.subplots_adjust(hspace=0.5) plt.show()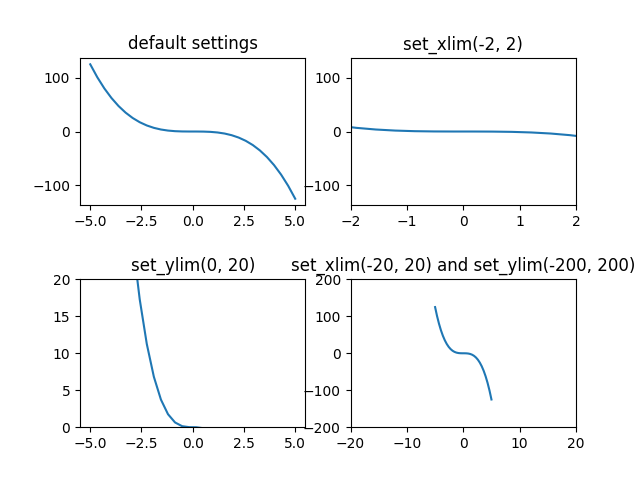
set_ybound and set_xbound are similar to xlim and ylim but are part of the object-oriented interface of matplotlib. xlim and ylim are set through global functions that are not tied to a specific plot object. We are going to modify the previous example of xlim and use set_xbound instead. The result is similar :
from matplotlib import pyplot as plt
fig,ax = plt.subplots(2,2)
x = np.linspace(-5, 5, 30)
y=[-x**3 for x in x]
ax[0,0].plot(x,y)
ax[0,0].set_title("default settings")
ax[0,1].plot(x,y)
ax[0,1].set_xbound(lower=-2,upper=2)
ax[0,1].set_title("xbound(lower=-2,upper=2)")
ax[1,0].plot(x,y)
ax[1,0].set_ybound(lower=0, upper=20)
ax[1,0].set_title("ybound(lower=0, upper=20)")
ax[1,1].plot(x,y)
ax[1,1].set_xbound(lower=-20, upper=20)
ax[1,1].set_ybound(lower=-200, upper=200)
ax[1,1].set_title("xbound and ybound")
fig.subplots_adjust(hspace=0.5)
plt.show()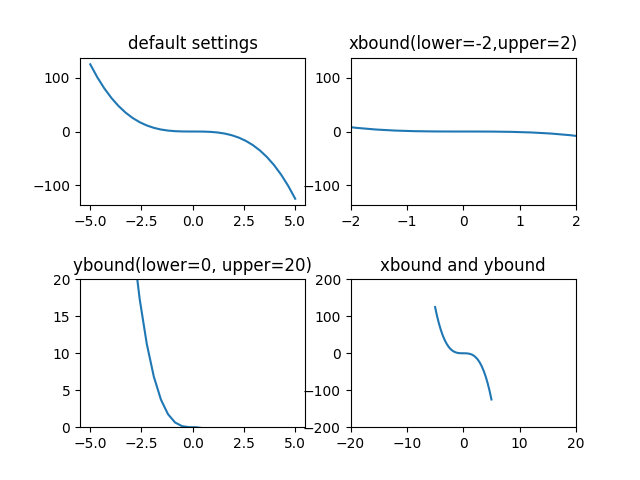
The following example demonstrates how xlim and set_xbound can produce different results. Matplotlib, after setting the range of the y-axis with set_ybound for the first plot, automatically adjusts the scale of the axis to encompass all the plotted data of the second plote. But after setting the range of the y-axis with ylim, it does not adjust the scale to the data of the second plot.
from matplotlib import pyplot as plt
fig,axs = plt.subplots(2,1)
x = np.linspace(-5, 5, 30)
y1=[-x**2 + 20 for x in x]
y2=[x**3  for x in x]
axs[0].plot(x,y1)
axs[0].set_ybound(lower=-8,upper= 8)
axs[0].plot(x,y2)
axs[0].set_title("ybound")
axs[1].plot(x,y1)
axs[1].set_ylim(-8, 8)
axs[1].plot(x,y2)
axs[1].set_title("ylim")
fig.subplots_adjust(hspace=0.5)
plt.show()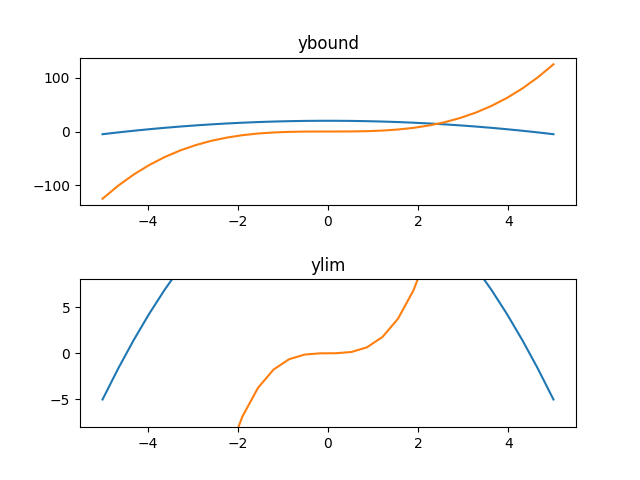
COLORSThere are several ways to define the color of a plot. Each way has its own syntax and method of specifying a color :
- By predefined color string: you can specify a color by using a predefined string keyword, such as red, blue, green, etc. It provides a basic set of colors that are suitable for most use cases, so you don't need to know the exact RGB or hexadecimal values of the color you want to use.
- By hexadecimal code, which is a string starting with # followed by 6 hexadecimal digits.
- By RGB: RGB stands for Red, Green, and Blue, and is another way of specifying a color. In RGB, you provide a tuple of values (R, G, B), where each value is in the range of 0-1
Matplolib provides several ways to change the color of various elements in a plot.
- changing the color of a plot: plt.plot(x, y, color='red')
- changing the color of an axes: ax.set_facecolor('#D8E1FF')
- changing the color of a figure: fig.set_facecolor((0.9, 0.9, 0.9))
- changing the color of a title: ax.set_title('A Plot', color='red')
- changing the color of a legend: ax.legend(edgecolor='red')
- changing the color of a label : ax.set_xlabel('xvalues',color='blue')
from matplotlib import pyplot as plt
fig,axs = plt.subplots(1,2)
x = np.linspace(-5, 5, 30)
y1=[-2*x+1 for x in x]
y2=[-x**2  for x in x]
axs[0].plot(x,y1,'red')
axs[0].plot(x,y2,'green')
axs[0].set_xlabel('x values',color='blue')
axs[0].set_ylabel('x values',color='brown')
axs[1].plot(x, y1, color='#800080',label='label 1')
axs[1].plot(x, y2, color=(0.5, 0, 1),label='label 2')
axs[1].legend(title='legend with edgecolor=\'red\'',edgecolor='red')
plt.show()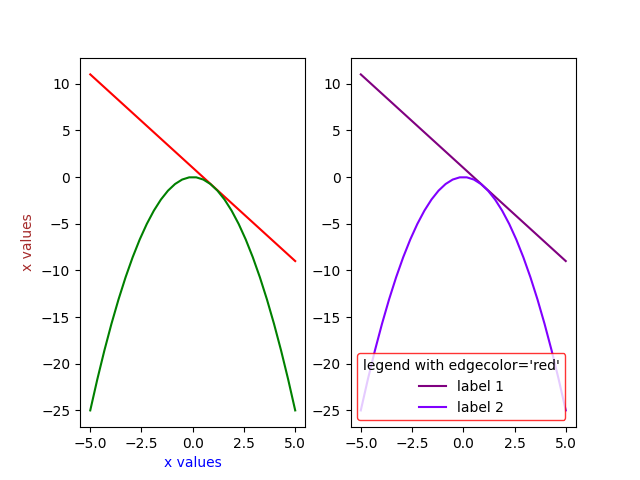
Link to Matlplotlib page : Named colorsfrom matplotlib import pyplot as plt fig,axs = plt.subplots(1,2) fig.set_facecolor('black') x = np.linspace(-5, 5, 30) y1=[-2*x+1 for x in x] y2=[-x**2 for x in x] fig.suptitle("fig.set_facecolor('black')",color='white') axs[0].set_facecolor('cyan') axs[0].set_title("axs[0].set_facecolor('cyan')",color='green') axs[0].plot(x,y1,'orange') axs[0].plot(x, y2, color='red') axs[1].set_facecolor('yellow') axs[1].set_title("axs[1].set_facecolor('yellow')",color='red') axs[1].plot(x,y1,color='#1F16FF') axs[1].plot(x,y2,color='#00009C') plt.show()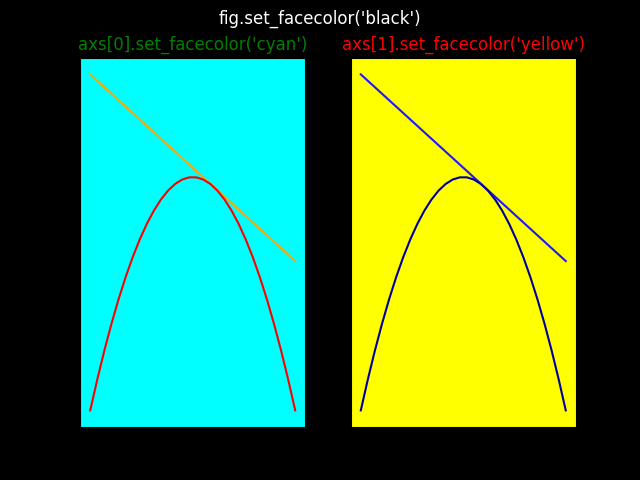
STYLE SHEETSA stylesheet is a file containing a set of predefined styles that can be used to customize the appearance of plots
You can read the list of available style sheets with :
A style sheet can be applied like this :print(plt.style.available)
Link to Matplotlib page : Style Sheets Referenceplt.style.use("ggplot")
LAYOUTThe tight layout feature is used to automatically adjust the positions of subplots and other plot elements so that they fit well within the figure window without overlapping or leaving too much whitespace.
Without tight layout :
from matplotlib import pyplot as plt
fig,axs = plt.subplots(2,2)
x = np.linspace(-5, 5, 30)
y=[-x**2  for x in x]
fig.suptitle("Without tight_layout")
axs[0,0].plot(x,y)
axs[0,1].plot(x,y)
axs[1,0].plot(x,y)
axs[1,1].plot(x,y)
plt.show()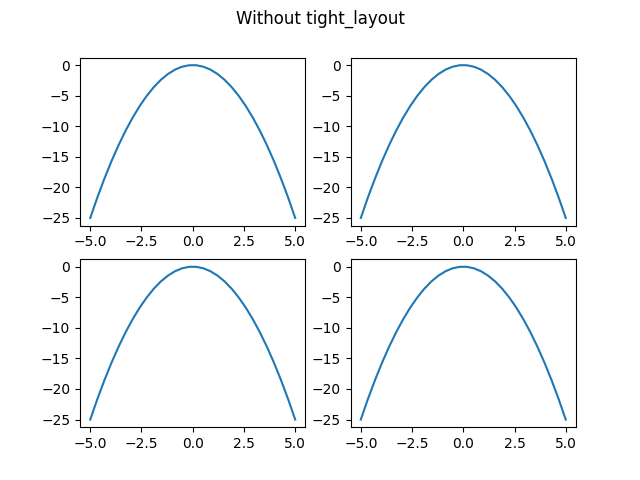
With tight layout :
from matplotlib import pyplot as plt
fig,axs = plt.subplots(2,2)
x = np.linspace(-5, 5, 30)
y=[-x**2  for x in x]
fig.suptitle("With tight_layout")
axs[0,0].plot(x,y)
axs[0,1].plot(x,y)
axs[1,0].plot(x,y)
axs[1,1].plot(x,y)
plt.tight_layout()
plt.show()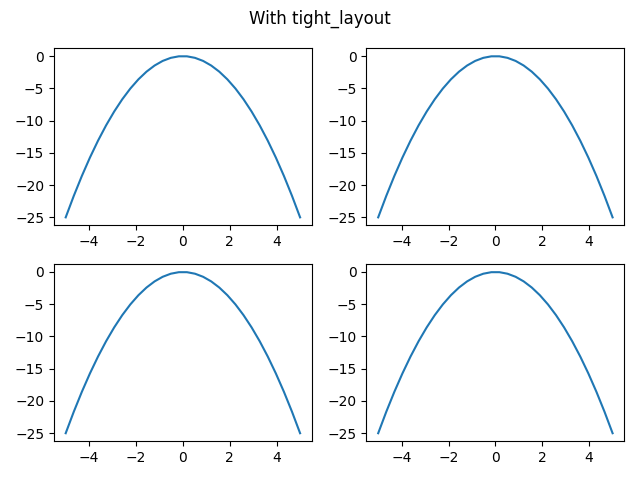
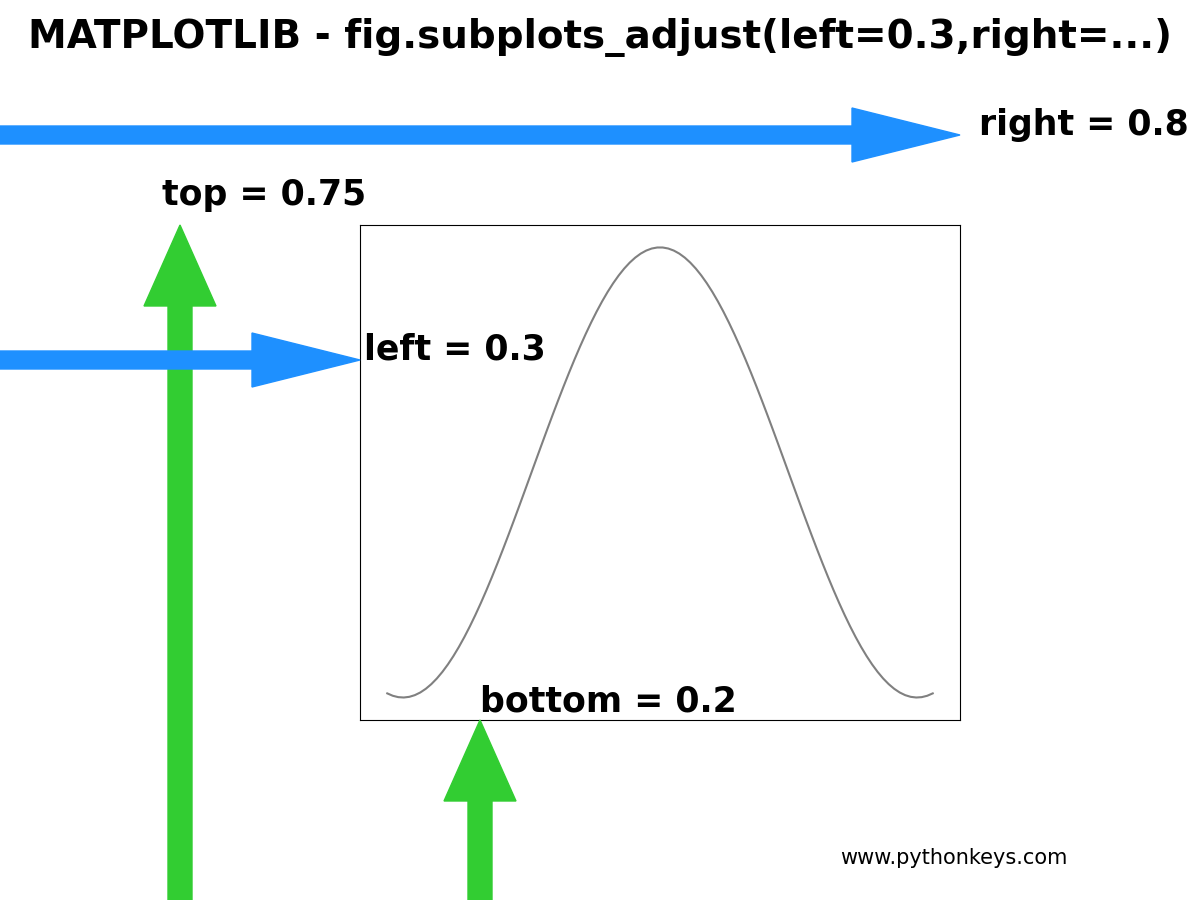
Subplots in a figure are arranged closely together, and sometimes this can result in the subplots overlapping or being difficult to read. To solve this problem, you can use the fig.subplots_adjust() method to adjust the spacing between subplots or to adjust the space between the top axes title and the figure title
- 'top' : adjust the space between the top of the figure and the top of the top-most axes
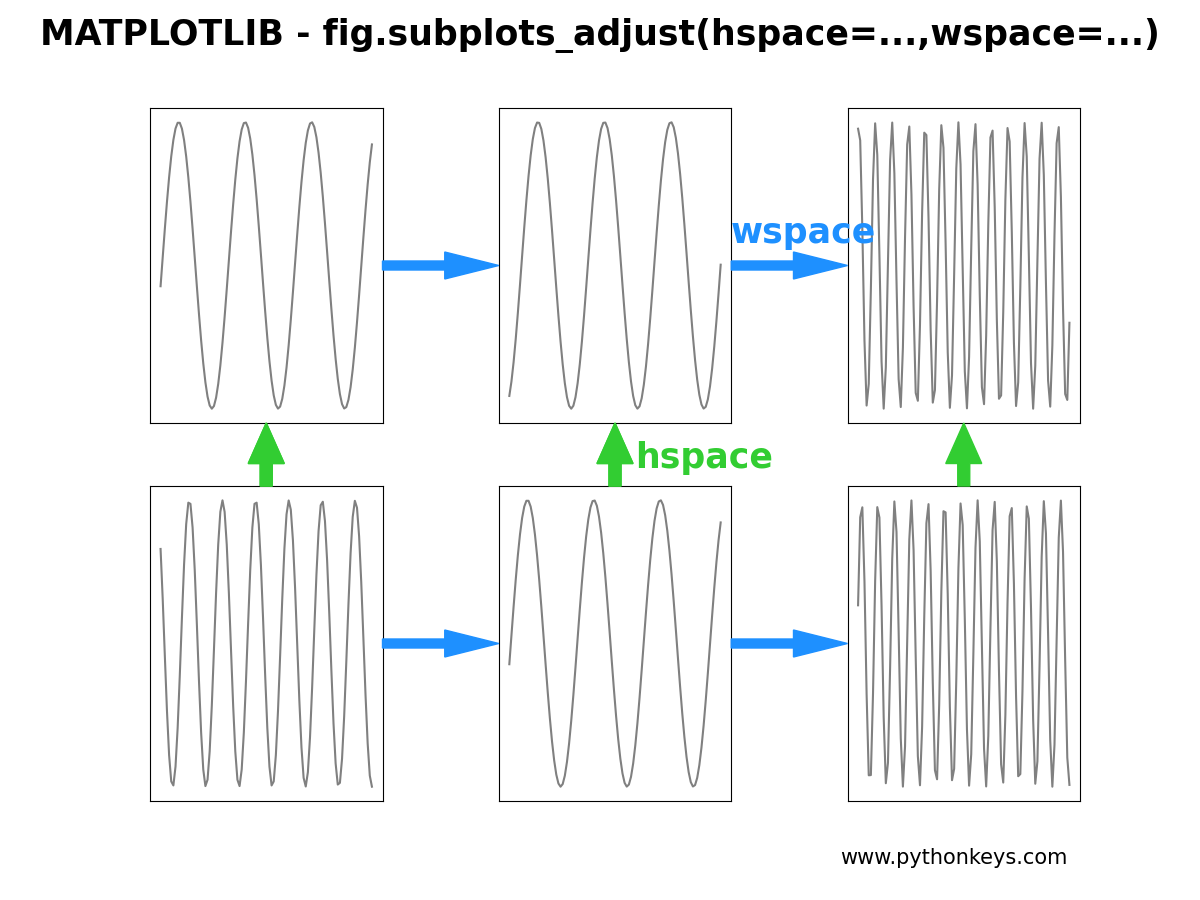
- 'hspace' : adjust the space between the bottom of the top-most axes. hspace=0.5 means that the vertical space between subplots will be half the height of a single subplot
The values of the top and hspace parameters in Matplotlib are specified as percentages of the height of the figure, starting from the bottom of the figure. For example, if you set the top parameter to 0.8, it means that the top edge of the top-most axes will be positioned at 80% of the height of the figure, starting from the bottom of the figure.
Wihtout subplots_adjust() :
from matplotlib import pyplot as plt
fig,axs = plt.subplots(2,1)
x = np.linspace(-5, 5, 30)
y=[-x**2  for x in x]
fig.suptitle("Titles Overlap",fontsize=20)
axs[0].plot(x,y)
axs[0].set_title("Title 1",fontsize=18)
axs[1].plot(x,y)
axs[1].set_title("Title 2",fontsize=18)
plt.show()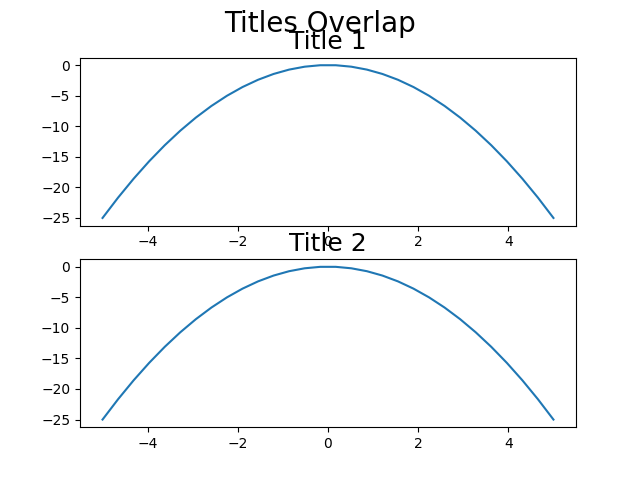
Wiht subplots_adjust() :
from matplotlib import pyplot as plt
fig,axs = plt.subplots(2,1)
x = np.linspace(-5, 5, 30)
y=[-x**2  for x in x]
fig.suptitle("fig.subplots_adjust(top=0.8,hspace=0.4",fontsize=20)
axs[0].plot(x,y)
axs[0].set_title("Title 1",fontsize=18)
axs[1].plot(x,y)
axs[1].set_title("Title 2",fontsize=18)
fig.subplots_adjust(top=0.8,hspace=0.4)
plt.show()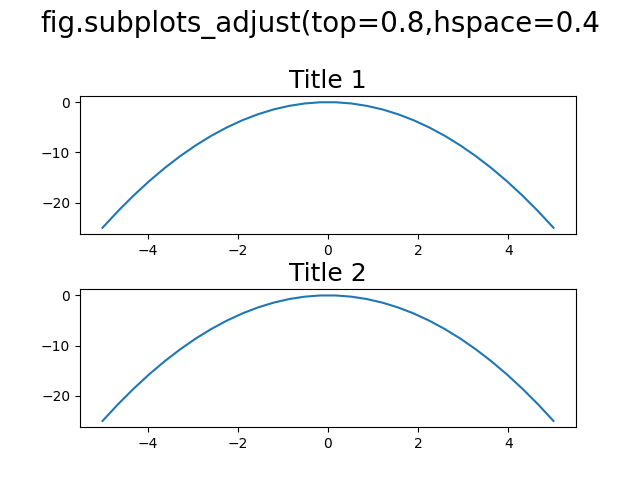
The illustrations below summarizes how the positioning in the figure works using fig.subplots_adjust :
4. SHEAT SHEET
# Create figure and Axes:
fig,ax= plt.subplots(3,4,figsize=(12,9),sharex=True)
fig,ax= plt.subplots(figsize=(12,9))
fig,(ax1,ax2)=plt.subplots(1,2)
fig,((ax1,ax2,ax3,ax4),(ax5,ax6,ax7,ax8),
(ax9,ax10,ax11,ax12))=plt.subplots(3,4)


# Figure : background color and themes
fig.set_facecolor('cyan')
plt.style.use("dark_background")

# Background Image, with import  matplotlib.image as mpimg
img = plt.imread('path/to/image.jpg')
ax.imshow(img, extent=[0, 10, 0, 10])
ax.imshow(img, aspect=1)

# Figure : title and text
fig.suptitle('title',color="black",fontname="verdana",style="italic",weight='bold',fontsize=18,y=0.9)
fig.text(0.5, 0.05, 'Text', ha='center', fontsize=14)

# Projection, for an Axes and for all Axes
ax=fig.add_subplot(231,projection="polar")
fig, ax = plt.subplots(subplot_kw=dict(projection='polar'))
fig, axs = plt.subplots(3,4,subplot_kw=dict(projection='polar'))
ax = fig.add_subplot(111, projection='3d')
fig,ax = plt.subplots(subplot_kw={'projection': '3d'})
fig,axs = plt.subplots(3,4,subplot_kw={'projection': '3d'})

# Limits :
ax.set_xlim(-2,2)
ax.set_ylim(bottom = 0) # upper = auto , after the data is plotted
ax.set_ylim(-2,2)
ax.set_zlim(-2,2)
ax.set_xlim([datetime.date(2022,1,1),datetime.date(2023,3,1)])
ax.set_xbound(lower=-2, upper=2)
ax.set_ybound(lower=-2, upper=2)

# Layout : space between Axes and  between top Axes et figure title
fig.subplots_adjust(top=0.8,hspace=0.4)
fig.subplots_adjust(bottom=0.2,hspace=0.4)

# Layout : optimized
plt.tight_layout()

# Relative sizes of subplots
fig, axs = plt.subplots(nrows=2, ncols=1, gridspec_kw={'height_ratios': [3, 1]})

# Plot : types and format
ax.plot(x,y,linewidth=2,linestyle='--',color='green')
ax.plot_surface(X, Y, Z, cmap='viridis')

# Axes : title
ax.set_title("title ",fontname="garmond", color='black',
weight='bold',style="italic",fontsize=18)

# Axes : labels
ax.set_xlabel('x values',color='blue')
ax.set_ylabel('x values',color='green')

# Axes : legend with data labels
ax.plot(x, y1, color='#800080',label='label 1')
ax.plot(x, y2, color=(0.5, 0, 1),label='label 2')
ax.legend(title='legend',loc='right',
edgecolor='red',facecolor='cyan')
ax.legend(bbox_to_anchor=(0.8,-0.2),ncol=5) # accurate position

# Axes : background color
ax.set_facecolor('cyan')

# Axes : fill between
ax.fill_between(x,y,0,color="green")

# Figure : dimensions in inches
fig.set_size_inches(12,9)

# Axis :
plt.axis('off')
ax1.axis('off'),ax2.axis('on')

# Set the aspect ratio of the plot to be equal in all dimensions
ax.set_aspect('equal')

# Grid
ax.grid(True, color='cyan')


# x-axis ticks labels frequency for Time Series
import matplotlib.dates as mdates
# configure intervals
ax.xaxis.set_major_locator(mdates.MonthLocator(interval=120))
# or configure months numbers
ax.xaxis.set_major_locator(mdates.MonthLocator(bymonth=[1,7]))
# and configure date format
ax.xaxis.set_major_formatter(mdates.DateFormatter('%Y-%m'))

# axis ticks colors and size
ax.tick_params(axis='x', colors='white',labelsize=15)
ax.tick_params(axis='y', colors='white', labelsize=15)

# Remove ticks and labels
ax.tick_params(axis='both', which='both', length=0, labelsize=0)
ax.set_yticks([])


# Spines : hide, move, intersection at 0,0, colors
ax.spines['top'].set_visible(False)
ax.spines['right'].set_visible(False)
ax.spines['left'].set_position('center')
ax.spines['left'].set_position(('zero')
ax.spines['bottom'].set_position('zero')
ax.spines['bottom'].set_color('white')

# Grid
ax.grid(True, color='cyan',linewidth=0.5)

# Annotate
plt.annotate("Point P", xy=(xp, yp), xytext=(xp + 0.2, yp + 0.2),ha='center',va='center',
 arrowprops=dict(facecolor='black', edgecolor='red', linewidth=1, arrowstyle='->'),
 color='cyan',fontsize=12,weight='bold'))
plt.annotate("No arrow", xy=(1,1), xytext=(1,1), arrowprops = None )
ax.annotate("Point P", xy=(4,1.7),xytext=(4,1.7), annotation_clip=False,
     color='white',fontsize=17,weight='bold' )

# Configure Polar
ax.set_thetagrids(np.arange(0,360,15), labels=['0', '','' ,'$\\frac{\\pi}{4}$', '$\\frac{\\pi}{3}$', '',
'$\\frac{\\pi}{2}$','', '$\\frac{2\\pi}{3}$', '$\\frac{3\\pi}{4}$', '', '', '$\pi$',
'', '', '$\\frac{5\\pi}{4}$', '$\\frac{4\\pi}{3}$', '', '$\\frac{3\\pi}{2}$', '',
'$\\frac{5\\pi}{3}$', '$\\frac{7\\pi}{4}$', '', ''],
fontsize=20)
ax.spines['polar'].set_edgecolor('blue')
ax.tick_params(pad=10)

# Save
plt.savefig(filename,dpi=300)

# 3D angle in degrees and zoom :
ax.azim=90 # max value 360 degrees
ax.elev=20 # max value 90 degrees
ax.set_box_aspect(aspect = (1,2,1),zoom=1.7)

# 3D surface and wireframe
ax.plot_wireframe(x, y, z,color="grey", linewidth=0.1)
ax.plot_surface(x, y, z, cmap='magma')
ax.plot_surface(x, y, z, color='blue', shade=True, rstride=1, cstride=1)
ax.light_sources = [(1, 1, 1)]
ax.shadows = True

# 3D grid color
ax.xaxis._axinfo['grid'].update({'color': (0, 0, 0, 1)})
ax.yaxis._axinfo['grid'].update({'color': (0, 0, 0, 1)})
ax.zaxis._axinfo['grid'].update({'color': (0, 0, 0, 1)})

# 3D panes, color, fill
ax.w_xaxis.set_pane_color((1, 0, 0))
ax.w_yaxis.set_pane_color((0, 1, 0))
ax.w_zaxis.set_pane_color((0, 0, 1))
ax.xaxis.pane.fill = False
ax.yaxis.pane.fill = False
ax.zaxis.pane.fill = False

# 3D axis off
ax.set_axis_off()