Get a list of named css colors:
from matplotlib import colors as mcolors
css_colors = list(mcolors.CSS4_COLORS.keys())
print(css_colors)
Get a list of named XKCD colors:
from matplotlib import colors as mcolors
xkcd_colors = list(mcolors.XKCD_COLORS.keys())
print(xkcd_colors)
Use XKCD colors:
ax.plot(x,y,linewidth=4,color='xkcd:cloudy blue')
Get the list of colormaps:
import matplotlib.cm as cm
print(dir(cm))
Get the list of scales for normalizations:
import matplotlib
matplotlib.scale.get_scale_
['asinh', 'function', 'functionlog', 'linear', 'log', 'logit', 'symlog']
Add a semi-transparent layer on top of the image :
import matplotlib.image as mpimg
img = mpimg.imread('path/to/image.jpg')
alpha = 0.5
gray = np.ones(img.shape[:2]) * 0.5
Create a 3D scatter plot with meshgrid :
x_min, x_max = -5, 5
y_min, y_max = -5, 5
z_min, z_max = -5, 5
x = np.linspace(x_min, x_max, 4)
y = np.linspace(y_min, y_max, 4)
z = np.linspace(z_min, z_max, 4)
X, Y, Z = np.meshgrid(x, y, z)
fig,ax = plt.subplots(figsize=(12,9),subplot_kw={'projection': '3d'})
plt.tight_layout()
ax.set_box_aspect(aspect = (1,1,1),zoom=1.1)
ax.set_xlim(-6,6)
ax.set_ylim(-6,6)
ax.set_zlim(-6,6)
ax.scatter(X.flatten(),Y.flatten(),Z.flatten(),
    s= 150,  marker='o', color='lime')
Streamplot : streamline vector plot with arrows and color map
x = np.linspace(-8, 8, 20)
y = np.linspace(-8, 8, 20)
X, Y = np.meshgrid(x, y)
E_total = 1 / ( X**2 + Y**2)
Ex, Ey = X,Y
plt.streamplot(X, Y, Ex, Ey,
                   linewidth = 1,
                   color = E_total,
                   density = 3,
                   cmap='cool'
            )
plt.show()
Streamplot : streamline vector plot, no color map, no arrow
x = np.linspace(-8, 8, 20)
y = np.linspace(-8, 8, 20)
X, Y = np.meshgrid(x, y)
E_total = 1 / ( X**2 + Y**2)
Ex, Ey = X,Y
plt.streamplot(X, Y, Ex, Ey,
                   linewidth = 1,
                   color = 'blue',
                   density = 3,
                   arrowstyle='-'
            )
plt.show()
Chart over a background image
background_image = plt.imread('my_background_image.jpg')
# Get the dimensions of the background image
image_height, image_width, channels = background_image.shape
# Define the DPI (dots per inch) of the new image - figure
dot_per_inch_figure = 100
# Calculate the figure size based on the image dimensions
fig_width = image_width / dot_per_inch_figure
fig_height = (image_height / image_width) * fig_width
fig = plt.figure(figsize=(fig_width, fig_height))
fig.suptitle('Annual data.', color='white', fontsize=30)
fig.figimage(background_image, 0, 0, origin='upper',zorder=-2, resize=True)
# Apply a transparent filter ( neutral cmap would be: gray)
alpha = 0.5
gray = np.ones(background_image.shape[:2]) * 0.5
fig.figimage(gray, 0, 0, cmap='winter', alpha=alpha, origin='upper',zorder=-1, resize=True)
# Add an ax on the transparent background
ax = fig.add_subplot(1, 1, 1)
ax.patch.set_facecolor('none')
# Spines set up
ax.spines['top'].set_visible(False)
ax.spines['right'].set_visible(False)
ax.spines['bottom'].set_color('white')
ax.spines['left'].set_color('white')
ax.tick_params(axis='x', colors='white',labelsize=15)
ax.tick_params(axis='y', colors='white', labelsize=15)
# Plot the bar chart
ax.bar(x , color = 'white')
plt.show()
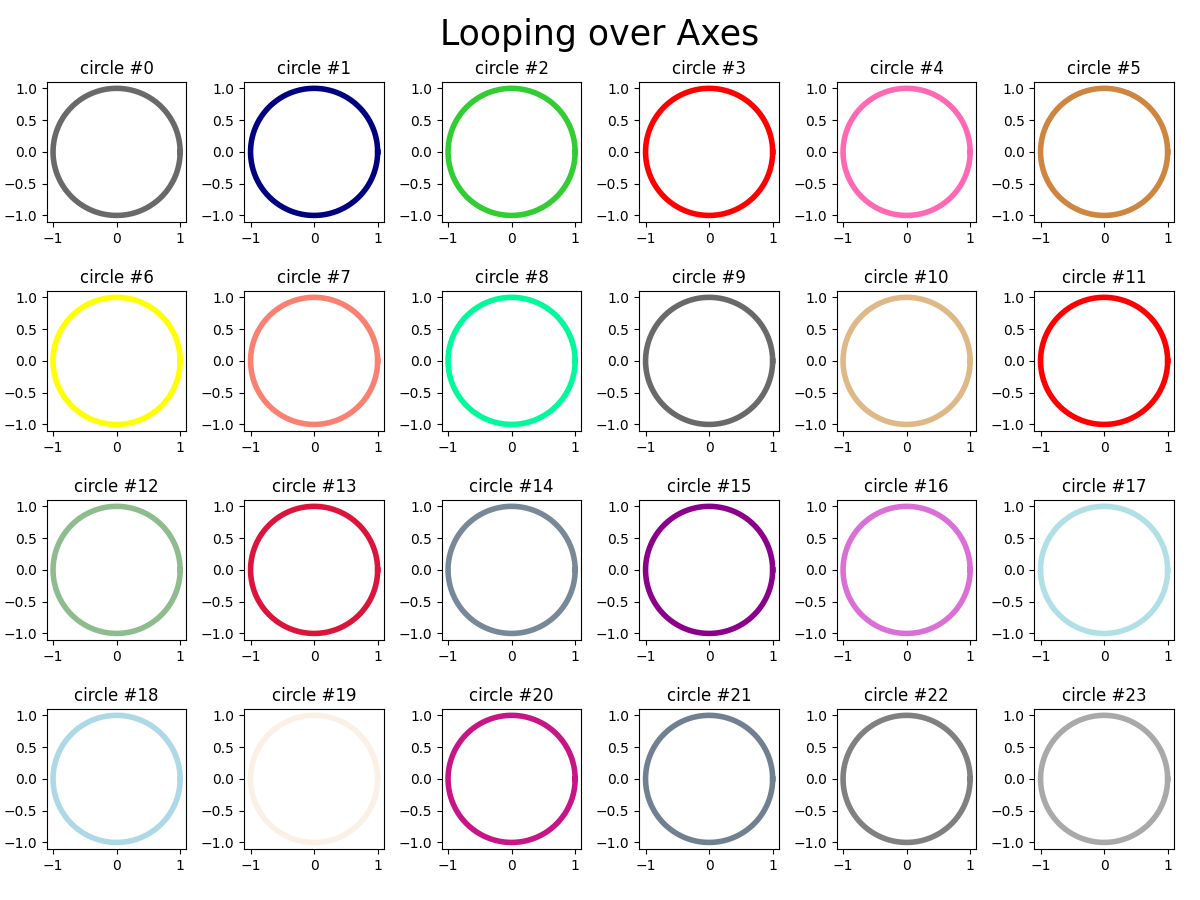
Looping over Axes
import matplotlib.pyplot as plt
from matplotlib import colors as mcolors
import numpy as np

fig,axs = plt.subplots(4,6,figsize=(12,9))
fig.suptitle('Looping over Axes',fontsize=25)
plt.tight_layout()
t = np.linspace(0, 2*np.pi, 100)
x = np.cos(t)
y = np.sin(t)
n = len(axs.flatten())
numbers = range(n)
css_colors = list(mcolors.CSS4_COLORS.keys())
my_colors=np.random.choice(css_colors,n)
for ax,number,color in zip(axs.flatten(),numbers,my_colors):
    ax.set_aspect('equal')
    ax.set_title(f'circle #{number}')
    ax.plot(x,y,color=color,linewidth=4)
plt.show()
LaTex - Matrix with line breaks - amsmath package
import matplotlib.pyplot as plt
plt.rcParams['text.usetex'] = True
plt.rcParams['text.latex.preamble'] = r'\usepackage{amsmath}'
s=r"""$\begin{pmatrix}3 & 3 \\4 & 2 \end{pmatrix}\begin{pmatrix}1 & 2 \\2 & 4 \end{pmatrix}$\\
$\begin{pmatrix}4 & 4 \\1 & 1 \end{pmatrix}\begin{pmatrix}3 & 1 \\1 & 4 \end{pmatrix} $"""
fig,ax = plt.subplots(figsize=(12,9))
fig.suptitle('MATRIX ',fontsize=30)
ax.text(0.2,0.1,s,fontsize=20)
plt.show()
LaTex - more expressions
plt.rcParams['text.usetex'] = True
    plt.rcParams['text.latex.preamble'] = r'\usepackage{amsmath}'
divergence =r"""$\operatorname{div}{\vec{A}} = \vec{\nabla} \cdot \vec{A}\ = {\frac{\partial A_{x}}{\partial x}}+{\frac{\partial A_{y}}{\partial y}}+{\frac{\partial A_{z}}{\partial z}}$"""

gradient_cartesian=r"""$\nabla f={\frac{\partial f}{\partial x}}\mathbf{i}+{\frac{\partial f}{\partial y}}\mathbf{j}+{\frac{\partial f}{\partial z}}\mathbf{k}$"""

gauss =r"""$\displaystyle\iint_{S}\vec{E}\cdot\vec{d S}=\frac{Q_{\mathrm{int}}}{\epsilon_{0}}$"""

matrix = r"""$\begin{pmatrix} 1 & 2 & 3 & 4 \\     5 & 6 & 7 & 8 \\     9 & 10 & 11 & 12 \\   13 & 14 & 15 & 16 \\     \end{pmatrix}$"""

integral = r"""$\displaystyle\int_{0}^{1} f(x) \,dx$"""

equations_system =r'$\begin{cases} 3x + 5y + z \\ 7x – 2y + 4z \\ -6x + 3y + 2z \end{cases}$'
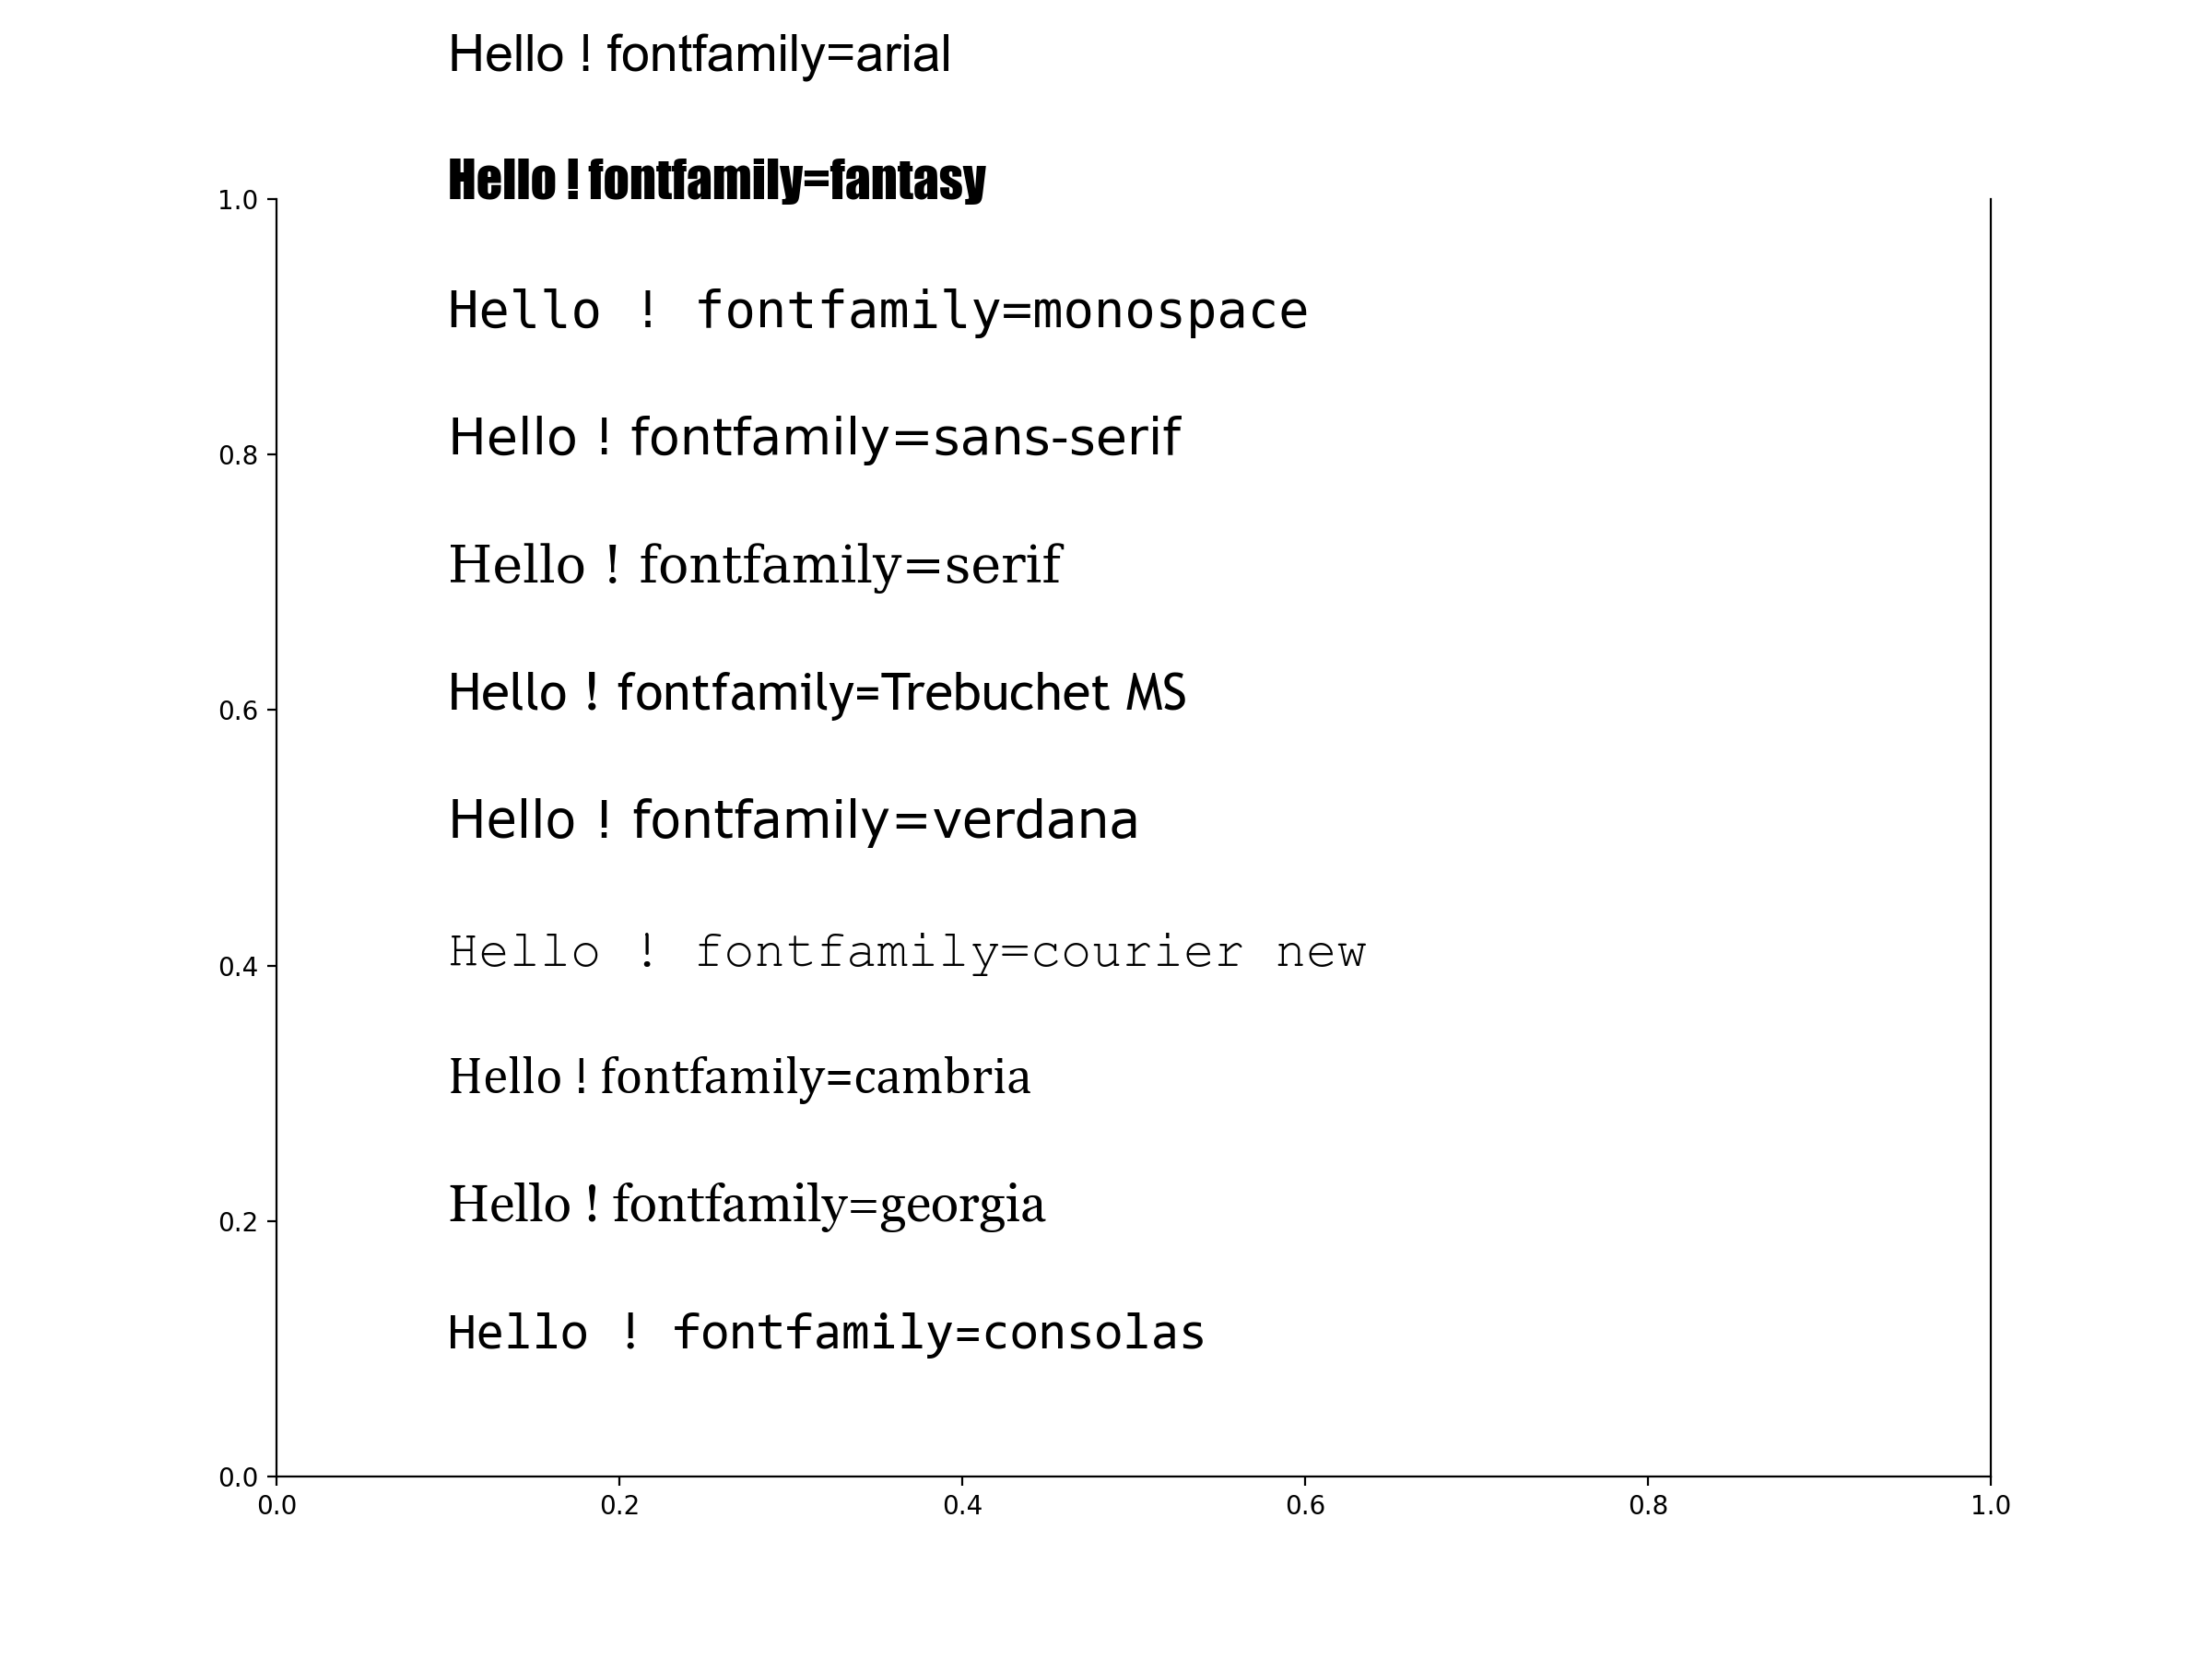
Font Families
import matplotlib.pyplot as plt
plt.rcParams['axes.spines.top'] = False
l = ['consolas','georgia','cambria','courier new','verdana','Trebuchet MS','serif', 'sans-serif',
         'monospace', 'fantasy','arial','Comic Sans MS']
fig,ax = plt.subplots(figsize=(12,9))
for index, font in enumerate(l,start=1) :
    ax.text(0.1, 0 + 0.1*index,f'Hello ! fontfamily={font}', fontsize=20, fontfamily=font)